
Figures & data
Figure 1. HDAC, HDACi and wt B-cells. (A) IgH locus (not to scale). The locations of V-D-J segments, Eµ enhancer, constant genes and 3’RR are indicated. The palindromic structure of the IgH 3’RR (to scale) with its four enhancer elements (hs3a, hs1,2, hs3b and hs4) and the IRIS sequences are represented. (B) HDAC1 fixation on enhancer elements of the 3’RR. ChIP experiments were performed on 2-day LPS-stimulated wt B-cell splenocytes (mean ± SEM of 5 experiments) and on 2-day LPS-stimulated ΔIRIS B-cell splenocytes (mean ± SEM of 6 experiments). The mock immunoprecipitation (IP) during ChIP is the control IP to avoid unspecific antigen-antibody reactions. Quantitative PCR experiments were compared between samples treated with HDAC1 antibodies (white bars) and unspecific antibodies (mock, black bars). Significance with the student-t-test for paired data. PCR primers for quantitative PCR are the following: hs4-Fw-ChIP 5'-CCATGGGACTGAAACTCAGGGAACCAGAAC-3'; hs4-Rev-ChIP5'-CTCTGTGACTCGTCCTTAGC-3'; hs3b-Fw-ChIP 5'-TGGTTTGGGCCACCTGTGCTGAG-3’; hs3b-Rev-ChIP 5'-GGGTAGGGCAGGGATGTT CACAT-3'; hs3a-Fw-ChIP 5'-GGGTAGGGCAGGGATGCTCACAT-3'; hs3a-Rev-ChIP 5'-GCTCTGGTTTGGGGCACCTGTGC-3'; hs1,2-Fw-ChIP 5'-AGCATACACTGGGACTGG-3'; hs1,2-Fw-ChIP 5'-CTCTCACTTCCCTGGGGTGTT-3'. ChIP experiments were done with HDAC1 (ab7028, Abcam) specific antibodies. (C) Influence of SAHA on in vitro B-cell growth, CSR and Ig secretion. Proliferation (six replicates) was evaluated with the MTS assay after 3 days stimulation with LPS (5 µg/ml) ± IL-4 (20 ng/ml) in the presence of 2µM and 200 nM SAHA. Results (mean ± SEM of 4 experiments) are reported as % of variations as compared to stimulated cells without SAHA (Mann-Whitney U-test for significance). IgG3 CSR (LPS stimulation) and IgG1 CSR (LPS + IL4 stimulation) were evaluated by flow cytometry. Results are reported as mean ± SEM of 4 and 5 experiments for IgG3 and IgG1, respectively (Mann-Whitney U-test for significance). In vitro Ig secretion was evaluated at day 4 by specific ELISAs. Results are reported as mean ± SEM of 4 and 5 experiments for IgG3 and IgG1, respectively (Mann-Whitney U-test for significance). (D) Influence of SAHA on 3’RR eRNAs. Sense (in black) and antisense (in grey) transcription in two-day LPS (5µg/ml) ± SAHA (200 nM) stimulated B-cell splenocytes of wt mice. One representative experiment out of two (pooled cells from three mice per group) is reported. The locations of the various 3’RR enhancer elements are reported. (E) Influence of SAHA on IgH locus transcription. IgM and IgG1 sense (in black) and antisense (in grey) transcription in LPS (5µg/ml) ± SAHA (200 nM) stimulated B-cell splenocytes of wt mice. Same samples as in D.
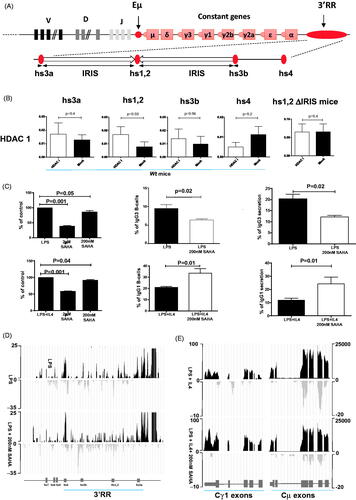
Figure 2. HDAC, HDACi and mature B-cell lymphomas. (A) Effect of SAHA on in vitro proliferation of mature B-cell lymphomas. Freshly isolated B-cell mature B220+CD19+IgM+IgD+ lymphomas from i Myc Eμ, i Myc Cμ and i Myc Cα; mice [2] were used. Each line represents one B-cell lymphoma. Each point represents the % of proliferation in response to LPS with or without 200nM SAHA (14 different mouse B-cell lymphomas). Each point is the mean of six replicates. B-cell lymphoma proliferation was evaluated with the MTS assay The first part of each graph shows the effect of LPS on the B-cell lymphoma proliferation Only B-cells lymphomas with a higher proliferation in response to LPS were investigated for SAHA treatment to withdrawn lymphomas unable to survey during the experimental conditions. (B) hs1,2 HDAC1 binding on freshly isolated mouse mature B-cell lymphomas. hs1,2 HDAC1 binding (mean ± SEM of 10 experiments) was analyzed by ChIP on freshly isolated mouse mature B-cell lymphomas (significance with the Wilcoxon matched paired test) from IgH-KI-c-myc mice. (C) 3’RR enhancer CBP binding on freshly isolated mouse mature B-cell lymphomas. CBP ChIP experiments were performed on freshly isolated B-cell lymphomas from IgH-KI-c-myc mice. Mean ± SEM of 4 experiments. Significance with the student-t-test for paired data. ChIP experiments were done with CBP (ab2832) specific antibodies
![Figure 2. HDAC, HDACi and mature B-cell lymphomas. (A) Effect of SAHA on in vitro proliferation of mature B-cell lymphomas. Freshly isolated B-cell mature B220+CD19+IgM+IgD+ lymphomas from i Myc Eμ, i Myc Cμ and i Myc Cα; mice [2] were used. Each line represents one B-cell lymphoma. Each point represents the % of proliferation in response to LPS with or without 200nM SAHA (14 different mouse B-cell lymphomas). Each point is the mean of six replicates. B-cell lymphoma proliferation was evaluated with the MTS assay The first part of each graph shows the effect of LPS on the B-cell lymphoma proliferation Only B-cells lymphomas with a higher proliferation in response to LPS were investigated for SAHA treatment to withdrawn lymphomas unable to survey during the experimental conditions. (B) hs1,2 HDAC1 binding on freshly isolated mouse mature B-cell lymphomas. hs1,2 HDAC1 binding (mean ± SEM of 10 experiments) was analyzed by ChIP on freshly isolated mouse mature B-cell lymphomas (significance with the Wilcoxon matched paired test) from IgH-KI-c-myc mice. (C) 3’RR enhancer CBP binding on freshly isolated mouse mature B-cell lymphomas. CBP ChIP experiments were performed on freshly isolated B-cell lymphomas from IgH-KI-c-myc mice. Mean ± SEM of 4 experiments. Significance with the student-t-test for paired data. ChIP experiments were done with CBP (ab2832) specific antibodies](/cms/asset/30beb2f8-48f8-41e3-98a0-f0f173698ecb/ilal_a_1961239_f0002_b.jpg)