Figures & data
Table 1. Patient and treatment characteristics.
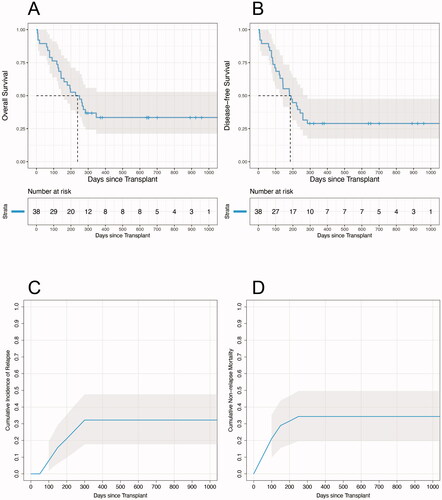
Figure 1. (A–B) Kaplan-Meier survival estimates showing overall survival and disease-free survival, respectively, after transplantation for the whole cohort. (C–D) Cumulative incidences of relapse and NRM after transplantation for the whole cohort. Gray shaded areas indicate 95% confidence intervals.