
Figures & data
Figure 1. Number of infections (any and severe) in the 12-month pre-SID diagnosis period (mean) and the post-SID period (mean annualized). SD: standard deviation; SID: secondary immunodeficiency.
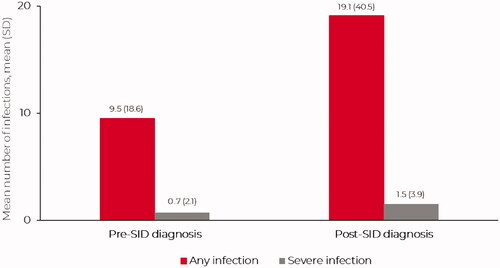
Figure 2. Percentage of patients who experienced a given number of any infections (A) or severe infections (B) in the 12-month pre-SID diagnosis period (absolute numbers) and post-SID periods (annualized numbers). *Absolute numbers of infections in the pre-SID period; annualized number of infections in the post-SID period (hence, a patient can have an annualized number of infections >0 and <1 infection during this period). SID: secondary immunodeficiency.
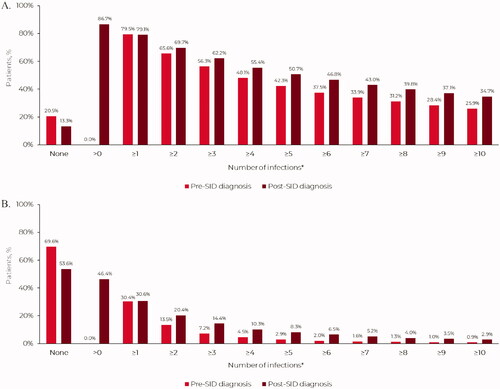
Figure 3. A ROC curve for infections pre-SID diagnosis as a predictor of risk of severe infections post-SID diagnosis. ROC: receiver operating characteristic; SID: secondary immunodeficiency.
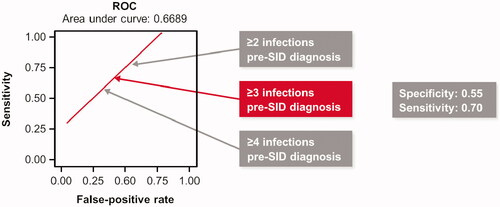
Table 1. Multivariate Cox proportional hazards model evaluating characteristics associated with risk of severe infections post-SID diagnosis.
GLAL-2021-0880-File009.pdf
Download PDF (741.6 KB)GLAL-2021-0880-File008.docx
Download MS Word (259.5 KB)GLAL-2021-0880-File007.docx
Download MS Word (258.5 KB)Data availability statement
The data that support the findings of this study are available from the corresponding author, SJ, upon reasonable request.