Figures & data
Table 1. Assessment of undernutrition degree by the CONUT score.
Table 2. Patients' characteristics at diagnosis.
Table 3. Nutritional status according to the CONUT score and patients' characteristics.
Figure 1. Association between the CONUT score and overall survival using the Cox proportional hazards model with restricted cubic spline with 4 knots. The solid line represents the log hazard ratio, and the shaded area is the 95% confidence interval. CONUT: controlling nutritional status.
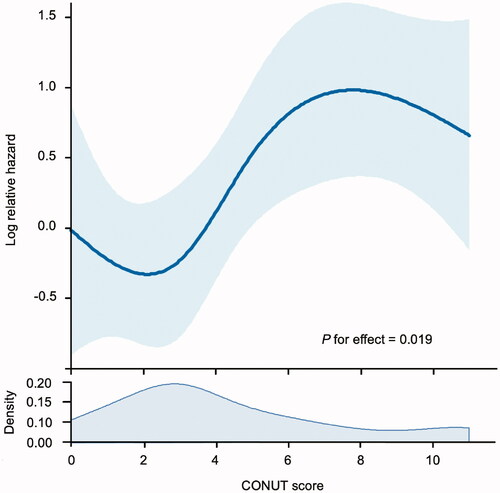
Table 4. Univariate and multivariate COX proportional hazards analysis of clinical factors significantly associated with overall survival.
Figure 2. Kaplan-Meier curves of overall survival among 4 groups (A) and 2 groups (B) of the CONUT score. CONUT: controlling nutritional status.
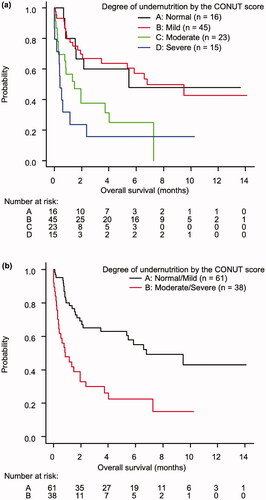
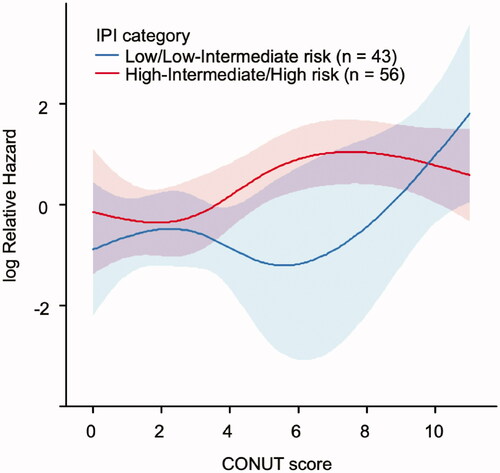
Figure 3. Association between the CONUT score and overall survival of four groups divided by the International Prognostic Index using a covariate-adjusted restricted cubic spline hazard model. The solid line represents the log hazard ratio, and the shaded area is the 95% confidence interval. IPI: International Prognostic Index; CONUT: controlling nutritional status.