
Figures & data
Table 1. Progression-free survival in patients randomized to ibrutinib- versus chlorambucil-based therapy by specified genomic risk features.
Figure 1. Response with ibrutinib- versus chlorambucil-based therapy by specified genomic risk features. CI: confidence interval; CR/CRi: complete response/complete response with incomplete bone marrow recovery; ORR: overall response rate. aNeither del(17p)/TP53 mutation nor del(11q). bNeither del(17p)/TP53 mutation/BIRC3 mutation nor del(11q)/SF3B1 mutation/NOTCH1 mutation. cRate ratio for ORR with ibrutinib-based therapy versus chlorambucil-based therapy.
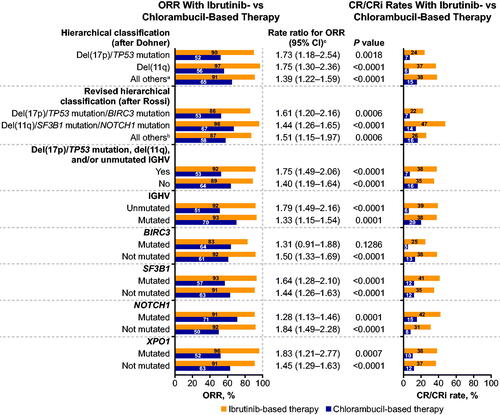
Figure 2. Forest plots of (A) progression-free survival and (B) overall survival with ibrutinib- versus chlorambucil-based therapy by specified genomic risk features. OS: overall survival; PFS: progression-free survival. aNeither del(17p)/TP53 mutation nor del(11q). bNeither del(17p)/TP53 mutation/BIRC3 mutation nor del(11q)/SF3B1 mutation/NOTCH1 mutation. cHazard ratio for PFS or OS with ibrutinib-based therapy versus chlorambucil-based therapy.
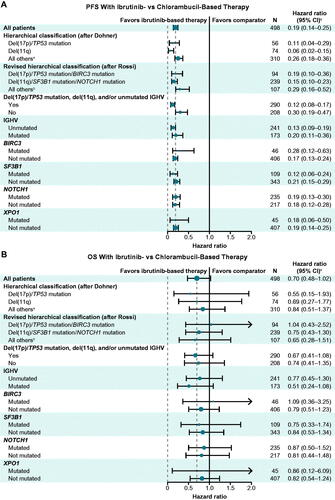
Figure 3. Response rates with ibrutinib-based therapy in patients with versus without specified high-risk genomic features. CI: confidence interval; CR/CRi: complete response/complete response with incomplete bone marrow recovery; NA: not applicable; ORR: overall response rate. aWithout high-risk feature = all others (neither del(17p)/TP53 mutation nor del(11q)). bWithout high-risk feature = all others (neither del(17p)/TP53 mutation/BIRC3 mutation nor del(11q)/SF3B1 mutation/NOTCH1 mutation). cRate ratio for ORR with versus without high-risk features.
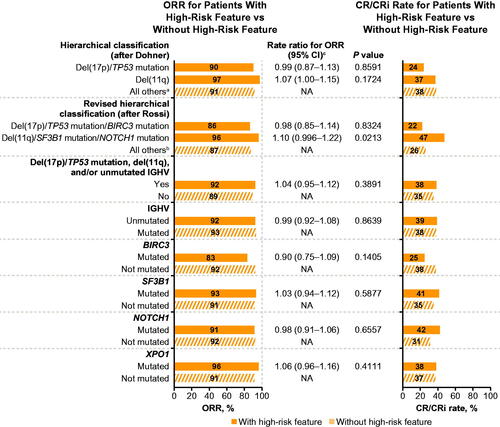
Figure 4. Forest plots of (A) progression-free survival and (B) overall survival with ibrutinib-based therapy in patients with versus without specified high-risk genomic features. CI: confidence interval; OS: overall survival; PFS: progression-free survival. aWithout high-risk feature = all others (neither del(17p)/TP53 mutation nor del(11q)). bWithout high-risk feature = all others (neither del(17p)/TP53 mutation/BIRC3 mutation nor del(11q)/SF3B1 mutation/NOTCH1 mutation). cHazard ratio for PFS or OS with versus without high-risk features.
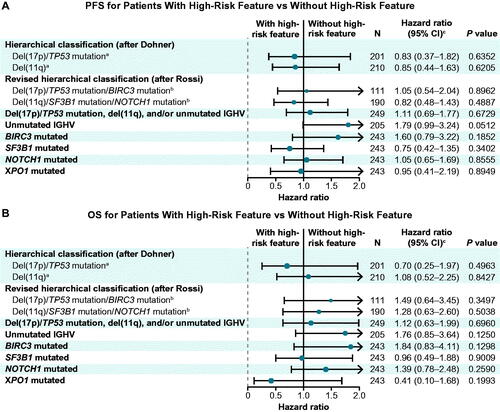
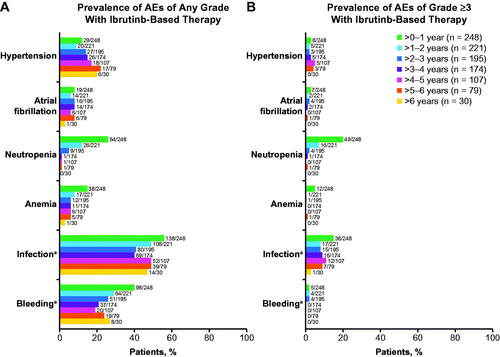
Figure 5. Prevalence of (A) any-grade AEs of clinical interest and (B) grade ≥3 AEs of clinical interest by yearly intervals in ibrutinib-treated patients. AEs: adverse events. aCombined terms. Infection was identified using the MedDRA System Organ Class term for Infections and infestations. Bleeding was identified using the Standardized MedDRA Query for Hemorrhage, excluding laboratory terms.
GLAL-2021-1034-File007.docx
Download MS Word (1.4 MB)Data availability statement
Requests for access to individual participant data from clinical studies conducted by Pharmacyclics LLC, an AbbVie Company, can be submitted through Yale Open Data Access (YODA) Project site at http://yoda.yale.edu