Figures & data
Figure 1. Structures of CAR-T cells and response to combination therapy. (A,B) The construct of anti-BCMA/CD38 CAR-T. (C) Response assessment after combination therapy.
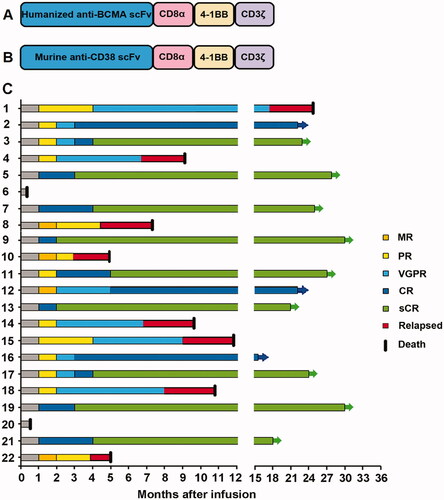
Table 1. Baseline characteristics in 22 relapsed/refractory multiple myeloma patients.
Figure 2. Changes in monoclonal immunoglobulin and light chain from baseline and survival in R/RMM to CAR-T. (A) The change in plasma M-protein concentration from baseline after CAR-T cell infusion. (B) The change in light chain concentration from baseline after CAR-T cell infusion. (C) The curve shows the time to progression after infusion of CAR-T cells. (D) The curve shows overall survival data censored at the time of the last follow-up.
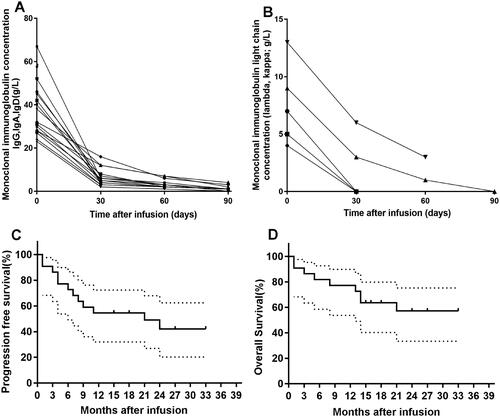
Table 2. Adverse event associated with treatment.
Figure 3. Serum cytokines associated with CRS severity. The chart shows the peak levels of serum cytokines over baseline in the first 30 days after infusion of CAR-T cells in patients with grade 1–2 CRS (n = 16) compared with patients with grade ≥3 CRS (n = 6). (A–C). Peak levels of IL-6, CRP and ferritin in the 1–2 grade CRS group were higher than those in the ≥3 grade CRS group (p < 0.001). (D–H) There was no significant difference in peak levels of IL-1β, IL-2R, IL-8, IL-10, and TNF-α between 1–2 grade and the ≥3 grade CRS groups (p = 0.643, p = 0.573, p = 0.064, p = 0.146, p = 0.462).
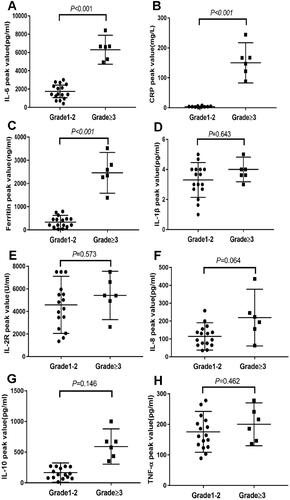
Table 3. Management of patients with CRS ≥ grade 3.
Table 4. Factors possibly associated with CRS.
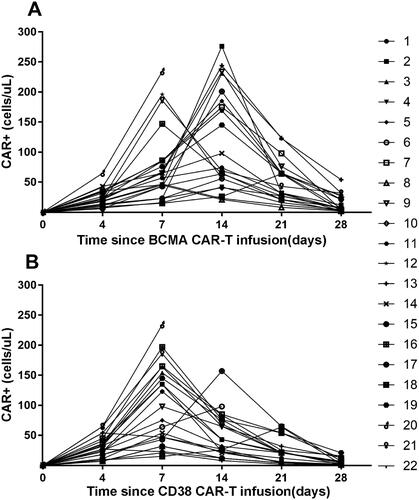
Figure 4. Expansion of CAR-T cells after infusion. CAR-T cell levels over time in peripheral blood are depicted, as measured by quantitative PCR for CAR sequence. (A) The absolute number of BCMA CAR+ cells/µl in peripheral blood within 28 days of infusion. (B) The absolute number of CD38 CAR+ cells/µl in peripheral blood within 28 days of infusion.