Figures & data
Figure 1. Cytotoxicity and synergism. AML cells were exposed to the indicated concentrations of bisantrene (Bis), venetoclax/ABT199 (ABT), panobinostat (Pano), decitabine (DAC) and olaparib (Ola), alone or in combination, for 48 h prior to determination of relative cell proliferation by the CCK8 assay (bar graph) and apoptosis by the Annexin V (line graph) assay. The results are averages of at least three independent experiments. To determine drug synergism, cells were exposed to various drug combinations at constant ratio concentrations for 48 h prior to proliferation assay. The relationships between the calculated combination indexes (CI, Y-axis) and fraction affected (Fa, X-axis) are shown below the bar graphs. CI <1.0 indicates synergism. The graphs are representatives of two independent experiments.
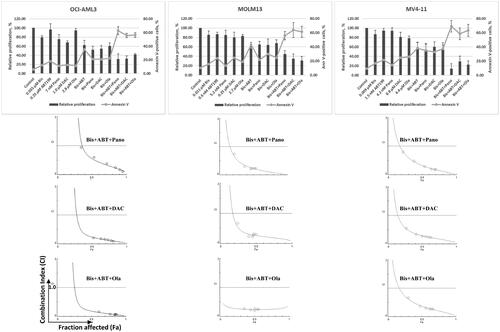
Figure 2. Determination of drug biochemical activities and activation of apoptosis. AML cells were exposed to the indicated concentrations of bisantrene (Bis or B), venetoclax/ABT199 (ABT or A), panobinostat (Pano or P), decitabine (DAC or D) and olaparib (Ola or O), alone or in combination, for 48 h. (A) Western blot analysis showing the effects of the histone deacetylase inhibitor Pano, the DNA methyl transferase inhibitor DAC, and the PARP inhibitor Ola on the level of AcH3K9, DNMT1 and PAR, respectively. (B) Changes in the level of modifications of protein markers of apoptosis. (C) Genomic DNA was isolated from drug-treated cells and resolved according to size using agarose gel electrophoresis in the presence of ethidium bromide. (D) Cells were exposed to drugs without or with 40 mM Caspase 3 inhibitor Z-VAD-FMK (Casp-i) for 48 h and analyzed for enzymatic activity and cleavage of Caspase 3 (Cleaved Casp 3).
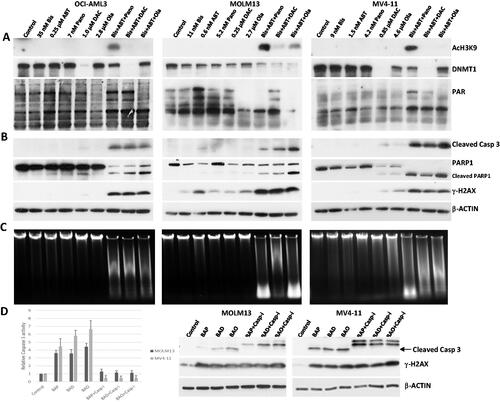
Figure 3. Drug effects on leukemia patient- and healthy donor-derived cells. Mononuclear cells were isolated from peripheral blood of (A) patients (characteristics shown in the upper panel) with hematological malignancies and (B) healthy donors, and exposed to the indicated drugs for 48 h prior to western blot analysis. Patient 2 cells exposed to triple drug combinations in panel B were used as positive control for western blot. Bis or B, bisantrene; ABT199 or A, venetoclax; Pano or P, panobinostat; DAC or D, decitabine; Ola or O, olaparib.
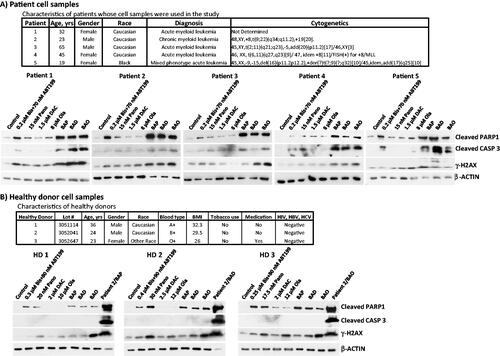
Figure 4. Drug-mediated changes in the production of reactive oxygen species (ROS) and in mitochondrial membrane potential (MMP). AML cells were exposed to the indicated concentrations of bisantrene (Bis or B), venetoclax (ABT199 or A), panobinostat (Pano or P), decitabine (DAC or D) and olaparib (Ola or O), alone or in combination, for 48 h prior to flow cytometric analysis.
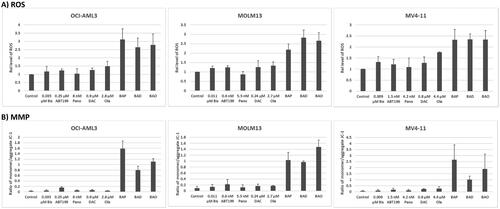
Figure 5. Effects of the three-drug combinations on the SAPK/JNK and PI3K signaling pathways in AML cells. Cells were exposed to drugs for 48 h and analyzed by western blotting. Drug abbreviations are as in .
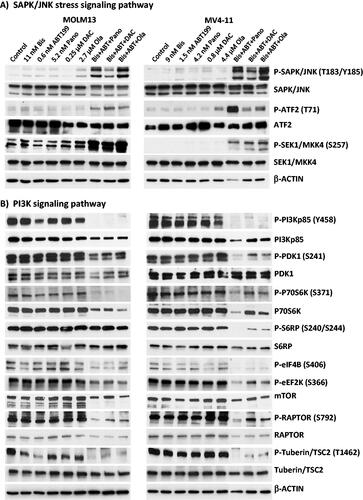
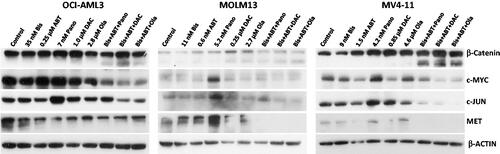
Figure 6. Drug-mediated inhibition of the Wnt/β-catenin pathway. AML cells were exposed to the indicated concentrations of bisantrene (Bis), venetoclax/ABT199 (ABT), panobinostat (Pano), decitabine (DAC) and olaparib (Ola), alone or in combination, for 48 h prior to Western blot analysis.