
Figures & data
Figure 1. Clustering of the high- and low-risk AML samples based on their cytogenetics and genetic aberrations using principal component analysis (PCA).
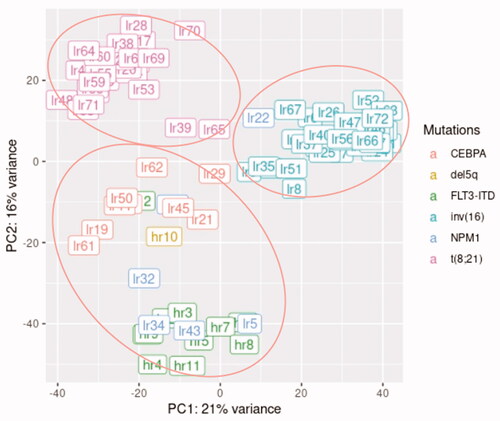
Figure 2. Workflow depicting the steps and methods used for the identification of genetic signature associated with poor prognosis in AML samples with FLT3-ITD mutation. AML: acute myeloid leukemia; CEBPA: CCAAT enhancer binding protein alpha; DGE: differential gene expression; FLT3-ITD: FMS-like tyrosine kinase 3-internal tandem duplications; MLP: multi-layer perceptron; NPM1: nucleophosmin-1; PCA: principal component analysis; TARGET: therapeutically applicable research to generate effective treatment.
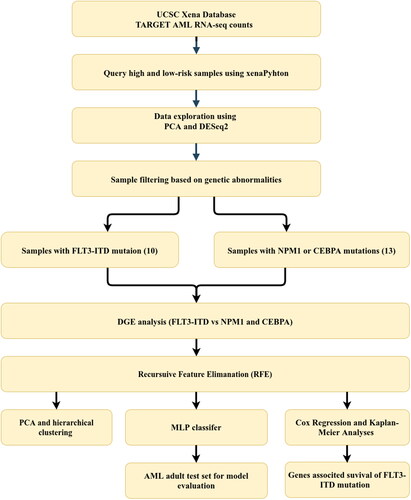
Table 1. Type of mutation, number of samples and risk category of TARGET high- and low-risk samples.
Figure 3. Clustering of the AML samples with FLT3-ITD and NPM1/CEBPA mutations using the 22 DEGs selected by RFE using (A) principal component analysis (PCA) and (B) hierarchical clustering using pheatmap R package.
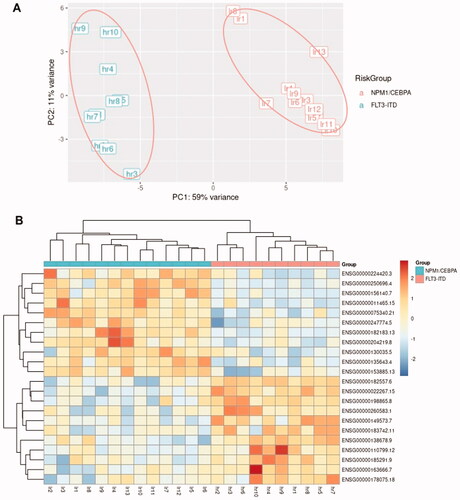
Table 2. List of the 22 DEGs selected by RFE genes with * was used in the ML model.
Figure 4. Kaplan–Meier’s plots of overall survival of patients with FLT3-ITD and NPM1/CEBPA mutations for survival scores above the median (continuous line), corresponding to high expression, and below the median (dotted line), corresponding to low expression, for the genes with positive Cox coefficients (A) FHL1, (B) SPNS3, and (C) MPZL2.
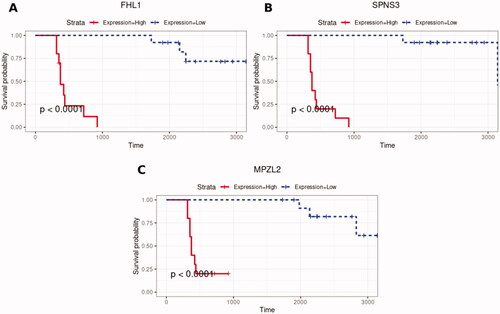
Table 3. The list of the DEGs related to overall survival and their corresponding coefficient values from the Cox regression model.