
Figures & data
Table 1. Baseline characteristics of patients according to EBV DNA copy number.
Table 2. Pathologic characteristics of patients according to EBV DNA copy number.
Table 3. Tumor cytogenetic features of patients according to EBV DNA copy number.
Figure 1. Frequencies and distribution of gene mutations in patients with DLBCL. A total of 41 DLBCL cases were performed with next-generation sequencing. Twenty-seven patients (65.85%) presented at least one variant. The bar chart above presented mutation in each patient. The bar chart nearby presented mutation frequency of each gene.
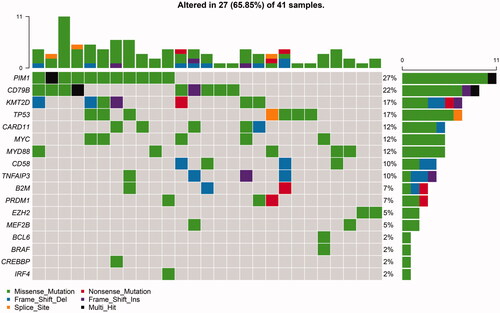
Figure 2. Kaplan–Meier’s estimates of (A) progression-free survival and (B) overall survival for the negative (<500 copies/ml), low (500–104 copies/ml), and high EBV-CN group (≥104 copies/ml), (C) progression-free survival, and (D) overall survival for positive group (EBV-DNA ≥ 500 copies/ml) and negative group (EBV-DNA <500 copies/ml), (E) progression-free survival and (F) overall survival for high EBV-CN group (EBV-DNA ≥ 1 × 10⁴ copies/ml) and not significantly increased EBV-CN group (EBV-DNA <1 × 10⁴ copies/ml).
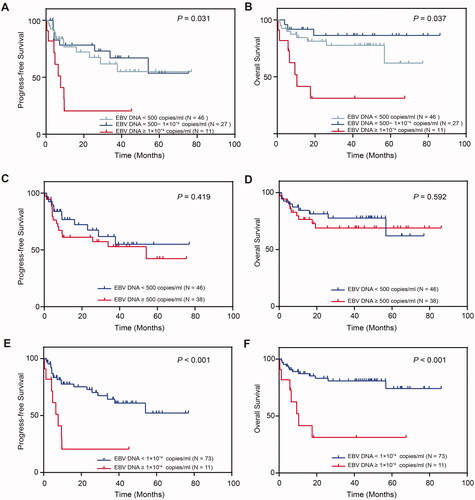
Table 4. Univariate and multivariate analyses of prognostic factors.