
Figures & data
Figure 1. Study design and patient disposition. The figure shows (A) Study design. (B) Patient disposition. *All patients (whether enrolled prior to cycle 1 or prior to cycle 2 of R-chemotherapy) who completed 6 cycles of SOC R-chemotherapy. †In patients who were receiving radiation therapy to bulky disease, this occurred after cycle 6 SOC R-chemotherapy and PET/CT was completed. ‡PET/CT was performed 3 weeks (±3 days) after cycle 6 SOC R-chemotherapy. §PET/CT must be performed 3 weeks (+3 days) after the last blinatumomab dose of cycle 1 (day 78 of cycle 1). ǁAt the discretion of the investigator, a second cycle of blinatumomab was administered to patients who did not have progressive disease. ¶PET/CT was performed 3 weeks (±3 days) after the last blinatumomab dose of cycle 2 (day 50 of cycle 2). #Safety follow-up visit was completed 30 days (±3 days) after the last dose of blinatumomab. ∗∗Patients should be followed for 1 year since the first dose of blinatumomab. ††If only cycle 1 of blinatumomab was given, long-term follow-up began 3 months (±3 weeks) after the last scan (day 78 of cycle 1). ‡‡If cycle 2 was given, long-term follow-up began 3 months (±3 weeks) after cycle 2 day 50. DLBCL: diffuse large B-cell lymphoma; IV: intravenous; PET/CT: positron emission tomography/computed tomography; R-chemotherapy: rituximab with chemotherapy; SOC: standard of care.
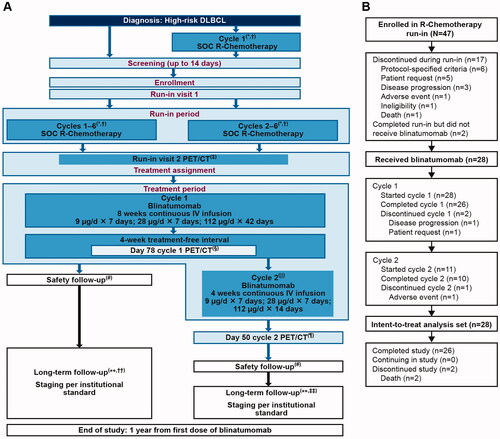
Table 1. Patient demographics and baseline disease characteristics.
Table 2. Incidence of TEAEs of interest.
Table 3. Summary of best response before and at the end of cycle 1 of blinatumomab.
Figure 2. Effect of cIV infused blinatumomab on peripheral T-cells during the first treatment cycle. (A) T-cell counts in four patients with stable disease (blue lines) and in other patients for whom data were available (gold lines) are presented as a fold-change from baseline during the first treatment cycle with blinatumomab. The expression of the immediate early activation marker CD69 on the surface of gated (B) CD4+ and (C) CD8+ T-cell subpopulations was determined by flow cytometry at baseline and throughout treatment for four patients with stable disease (blue lines) and other patients for whom data were available (gold lines). The percentages of activated, CD69+ T-cell subpopulations were calculated and presented as an absolute fold-change from baseline during the first treatment cycle with blinatumomab. Fold-change was calculated as c × 2 raised to the power of the c × log2 ratio of the post-treatment result over the pretreatment result, where c = +1 for log2 ratios ≥0 or c = −1 for log2 ratios <0. Absolute change for percentage endpoints was calculated as a difference between the post-treatment and pretreatment result. C: cycle; CD: cluster of differentiation; cIV: continuous intravenous; CR: complete response; D: day; HR: hour; PR: partial response; R-chemotherapy: rituximab with chemotherapy.
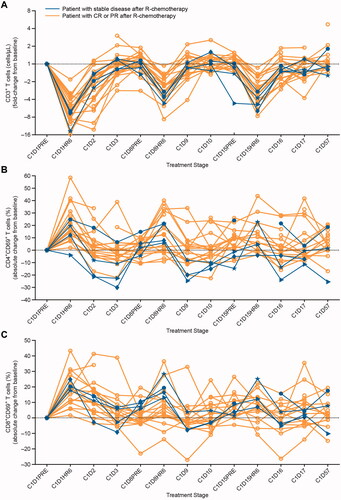
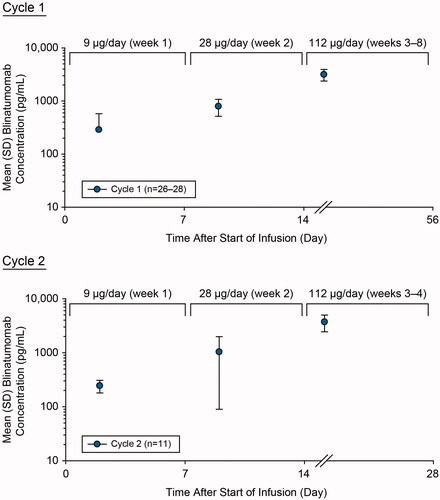
Figure 3. Assessment of pharmacokinetics of blinatumomab during cycle 1 and cycle 2. Mean (SD) blinatumomab serum concentration-time profiles after cIV blinatumomab at 9 µg/day (week 1), 28 µg/day (week 2), and 112 µg/day (week 3 onward) for cycles 1 and 2 in adult patients with newly diagnosed, high-risk DLBCL. cIV: continuous intravenous; DLBCL: diffuse large B-cell lymphoma; SD: standard deviation.
GLAL-2021-1075-File008.tif
Download TIFF Image (599.3 KB)GLAL-2021-1075-File007.jpg
Download JPEG Image (600 KB)
GLAL-2021-1075-File006.jpg
Download JPEG Image (1.4 MB)
Data availability statement
Qualified researchers may request data from Amgen clinical studies. Deidentified individual participant data are available indefinitely at http://www.amgen.com/datasharing