
Figures & data
Figure 1. B-cell proliferation in iMycCα mice. (A) IgH locus (not to scale) with the location of the inserted Myc. Locations of PCR primers for mice screening are indicated. (B) Screening of heterozygous and homozygous iMycCα mice. One representative experiment with two wt mice, two heterozygous, and two homozygous iMycCα mice. Left panel: detection of the inserted Myc (the forward P3 and reverse P4 primers hybridize to the KI Myc cDNA; PCR band of ≃1500 bp). Right panel: detection of heterozygous and homozygous iMycCα mice (the forward P1 and reverse P2 primers are in Cα). PCR bands of ≃2000 bp and ≃5000 bp for wt and KI alleles, respectively. (C) Western blot analysis of c-myc in B-cell splenocytes from four heterozygous and five homozygous iMycCα mice. β-actin was used as a control gene. Data, expressed as means ± SEM, were analyzed using Prism software (GraphPad Software). Significance was determined with the Mann–Whitney U-test. (D) Proliferation of spleen B-cells from heterozygous and homozygous iMycCα mice in response to various concentrations of LPS + anti-CD40. Results are reported as mean ± SEM of 5 mice per genotype. Significance determined with the Mann–Whitney U-test.
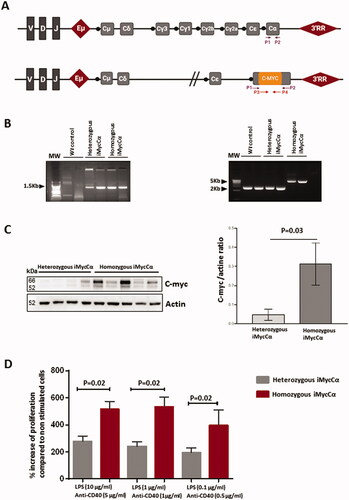
Figure 2. B-cell development in iMycCα mice. (A) Percentage of immature and mature B-cell subtypes (flow cytometry analysis) in heterozygous and homozygous iMycCα mice. Pre-pro-B-cells (B220+CD19+CD43+CD117+ CD24-CD25−), large pre-B-cells (B220+CD19+ CD43 +−CD117-CD24+CD25+−), and immature B-cells (B220+CD19+CD117-CD24+CD25-IgM+IgD−) were investigated in femoral bone marrow. B220+ B-cells, FO B-cells (B220+IgM+IgDhighCD21highCD23high) and MZ B-cells (B220+IgMhighIgDlowCD21highCD23low) were studied in the spleen. Results are reported as mean ± SEM of 3–6 mice. Significance determined with the Mann–Whitney U-test. (B) Percentage of CD138+ B-cells in spleen and bone marrow from heterozygous and homozygous iMycCα mice. Right panel: One representative experiment is shown (B220 and CD138 labeling). Left panel: Results are reported as mean ± SEM of 5 mice. Significance determined with the Mann–Whitney U-test.
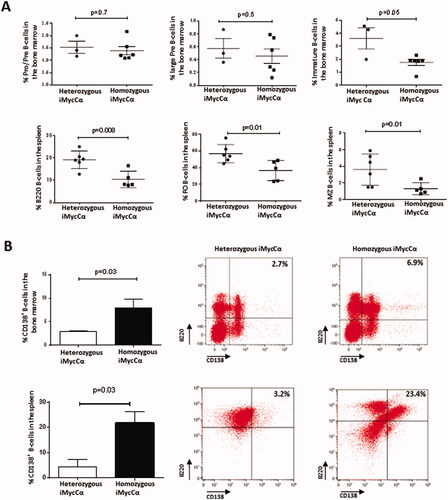
Figure 3. CSR and Ig synthesis in homozygous iMycCα mice. (A) Serum IgM, IgG1, IgG3, and IgA in heterozygous and homozygous iMycCα mice. Ig levels were assessed by specific ELISA. Results are reported as mean ± SEM of 5 mice. Significance was determined with the Mann–Whitney U-test. (B) CSR in B-cells from heterozygous and homozygous iMycCα mice. On representative flow cytometry analysis for IgG1, IgG3, and IgA CSR. Results are reported as mean ± SEM of 5 mice. Significance was determined with the Mann–Whitney U-test. C: In vitro Ig secretion by spleen B-cells from heterozygous and homozygous iMycCα mice. Results are reported as mean ± SEM of 5 mice. Significance was determined with the Mann–Whitney U-test. Same cells as in B.
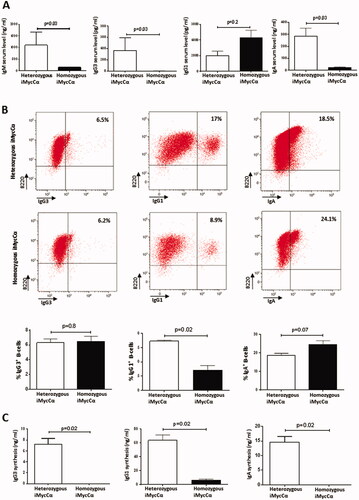
Figure 4. B-cell lymphomas in homozygous iMycCα mice. (A) Typical flow cytometry analysis of B-cell lymphomas. Cells previously gated on SSC/FSC parameters were labeled with anti-B220/anti-CD43, anti B220/anti-CD117, anti-B220/anti-CD138, anti-B220/antiCD19 antibodies. Cells labeled with anti-IgM/anti-IgD antibodies were previously gated on B220+CD19+ cells. B: Time course generation of B-cell lymphomas in heterozygous and homozygous iMycCα mice. Significance was determined with the Mann–Whitney U-test. (C) B-cell lymphoma maturity from homozygous iMycCα mice. Upper panel: Percentages of mature (IgM+IgD+) and immature (IgM +−IgD-) B-cell lymphomas (30 B-cell lymphomas per group). Lower panel: Percentages of CD138+ B-cell lymphomas among mature B-cell lymphomas (30 mature B-cell lymphomas per group). Significance was determined with the Mann–Whitney U-test. D: Western blot analysis of c-myc in CD138+ B-cell lymphomas from homozygous iMycCα mice. β-actin was used as control gene. We studied c-myc in nine different freshly isolated CD138+ B-cell lymphomas. Each line corresponds to a B-cell lymphoma obtained from one mouse. Two types of different CD138+ B-cell lymphoma were documented: one expressing low levels of c-myc (lines 5, 6, and 7) and one expressing high levels of c-myc (lines 1, 2, 3, 4, 7, and 8).
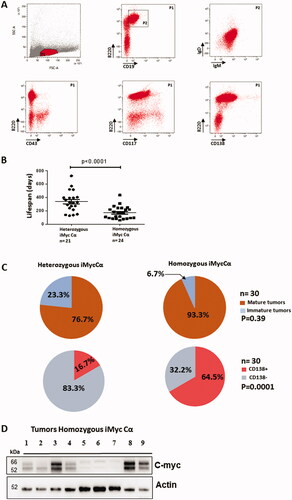
Figure 5. Transcriptome analysis of CD138+ and CD138- B-cell lymphomas. (A) Principal component analysis (PCA) of RNA-Seq gene expression data from 9 CD138+ (in red and green) and 3 CD138− (in blue) B-cell lymphomas. The location of 5 c-myc- CD138+ B-cell lymphomas is indicated in red. The location of 4 c-myc+ CD138+ B-cell lymphomas is indicated in green. (B) Volcano plot of differential gene expression in CD138+ and CD138− B-cell lymphoma samples. Up-regulated (in red) and down-regulated (in green) genes are shown. (C) Heat map of 100 most variable gene expressions across B-cell lymphoma samples (9 CD138+ and 3 CD138−); hierarchical clustering of genes/samples according to Pearson’s correlation metric and Ward’s method.
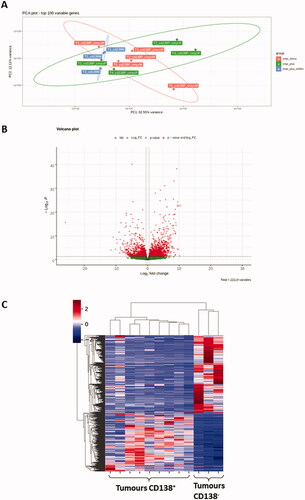
Figure 6. Transcriptome analysis of CD138 B-cell lymphomas. (A) Differentially expressed genes implicated in several metabolic/signaling pathways in CD138+ and CD138- B-cell lymphomas. The node circle size represents the number of genes in the pathway and the node circle colors (red and blue) correspond to the adjusted p values. (B) Detailed GSEA analysis of differentially expressed genes against human BL (http://www.informatics.jax.org/disease/DOID:8584) and multiple myeloma (C0026764: https://www.ncbi.nlm.nih.gov/medgen/10122) signatures.
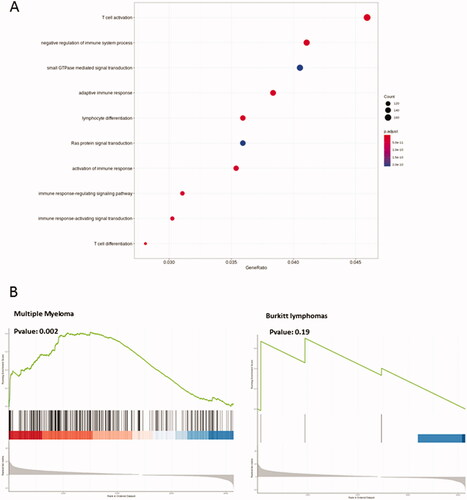
Table 1. Up and down-regulated genes in Myc+ vs. Myc − CD138+ B-cell lymphomas. Log2 fold change (FC) threshold >1 and adjusted p value <0.05.