
Figures & data
Table 1. Comparison of descriptive statistics by race.
Table 2. Univariate and multivariable analysis of the association between select variables and clinical outcomes.
Figure 1. Kaplan–Meier curves for overall survival (OS) stratified by race.
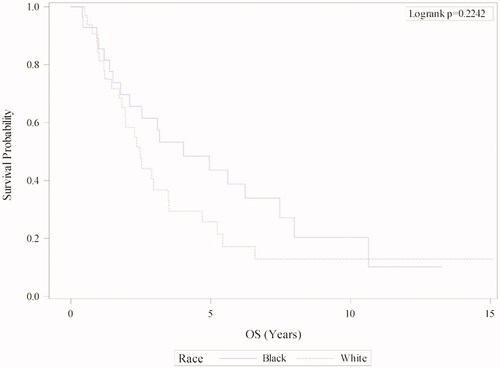
Table 3. Distribution of treatment regimens received after diagnosis of Sézary syndrome.
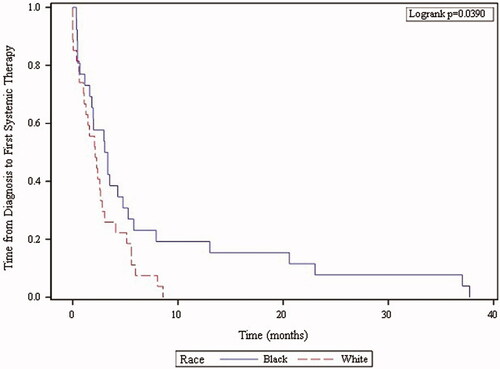
Figure 2. Kaplan–Meier curves for time from diagnosis to initiation of first systemic therapy stratified by race.
Supplemental material
GLAL-2021-1196-File005.pptx
Download MS Power Point (37.2 KB)GLAL-2021-1196-File004.pptx
Download MS Power Point (284.2 KB)Data availability statement
Data were available within the article or its supplementary materials.