
Figures & data
Table 1. Characteristics of 1417 AML and 306 ALL patients overall and by ICU admission in the matched cohort.
Figure 1. Prevalence of first time ICU admissions by treatment course for AML and ALL patients. Timing of first time ICU admission according to diagnosis and initiation of treatment cycle 1, 2, and 3 or consolidation for AML and ALL patients.
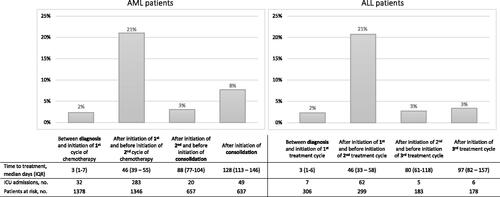
Figure 2. Kaplan Meier curves of ICU admission risk and survival. Proportion of patients with ICU admission by time according to WHO PS for AML (A) and ALL (B) and according to number of comorbidities for AML (C) and ALL (D). Crude survival from index date by ICU status for AML (E) and ALL patients (F).
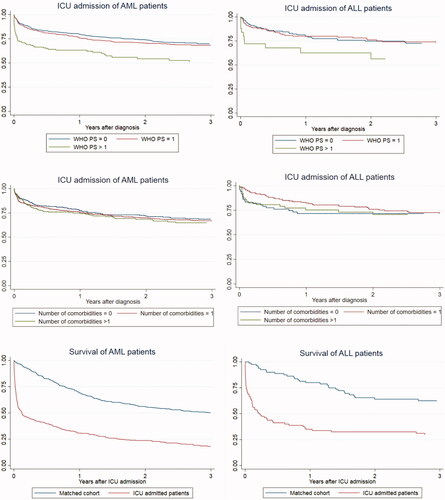
Table 2. Potential risk factors for ICU admission in 1417 AML and 306 ALL patients.
Table 3. Mortality after ICU admission in AML and ALL patients.
Table 4. Mortality after dialysis or mechanical ventilation in the ICU for AML and ALL patients.