
Figures & data
Table 1. Demographic and baseline characteristics.
Figure 1. Summary of response rates over time. Data for induction cycles 1–4 are from the primary endpoint analysis [Citation12,Citation39]. Response data are also shown for the end of induction and end of study, occurring after all patients completed 1 year of maintenance therapy and were followed for 36 months after the start of induction therapy, died, or withdrew from the study (median follow-up at end of study: NDMM, 35.7 months). Percentages may not add to 100% due to rounding. NDMM: newly diagnosed multiple myeloma; ORR: overall response rate; VGPR: very good partial response; CR: complete response; PR: partial response; sCR: stringent complete response.
![Figure 1. Summary of response rates over time. Data for induction cycles 1–4 are from the primary endpoint analysis [Citation12,Citation39]. Response data are also shown for the end of induction and end of study, occurring after all patients completed 1 year of maintenance therapy and were followed for 36 months after the start of induction therapy, died, or withdrew from the study (median follow-up at end of study: NDMM, 35.7 months). Percentages may not add to 100% due to rounding. NDMM: newly diagnosed multiple myeloma; ORR: overall response rate; VGPR: very good partial response; CR: complete response; PR: partial response; sCR: stringent complete response.](/cms/asset/e6b9a47b-283d-4c5b-b7f1-ca060029e3b6/ilal_a_2076847_f0001_c.jpg)
Figure 2. PFS in NDMM patients by (A) transplant status and (B) by transplant status and response. Results of the Kaplan–Meier estimates of PFS at end of study are shown by (A) transplant status among patients who received ≥1 dose of study treatment, and by (B) transplant status and response among the response evaluable population. Median PFS was not reached for any group, and estimated 24- and 36-month PFS rates are provided in the figures. The symbols for panel A are as follows: empty squares, NDMM transplant group; empty triangles, NDMM non-transplant group. For Panel B, the symbols are: empty squares, NDMM transplant with ≥CR group; filled squares, NDMM transplant with ≤VGPR group; empty triangles, NDMM non-transplant with ≥CR group; filled triangles, NDMM non-transplant with ≤VGPR group.
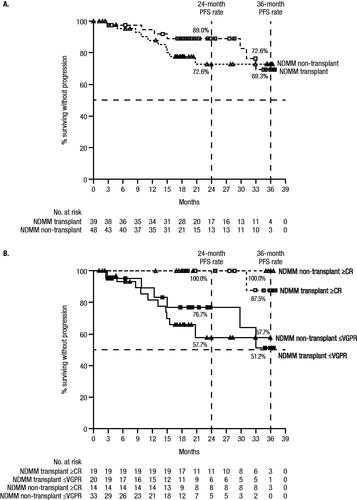
Table 2. Most common TEAEs of any grade (≥25%) and grade 3/4 (≥10%) in the safety analysis set.a
Table 3. Most common TEAEs of any grade (≥20%) and grade 3/4 (≥5%) occurring during the maintenance phase of study therapy in the safety analysis set.a,b
GLAL-2022-0011-File008.pdf
Download PDF (341 KB)Data sharing statement
The data sharing policy of Janssen Pharmaceutical Companies of Johnson & Johnson is available at https://www.janssen.com/clinical-trials/transparency. As noted on this site, requests for access to the study data can be submitted through Yale Open Data Access (YODA) Project site at http://yoda.yale.edu.