
Figures & data
Figure 1. Observed and MAIC adjusted outcomes: (A) PFS KM and (B) OS KM overlay curves for KarMMa ide-cel-treated population versus DREAMM-2 2.5 mg/kg bela-maf population, including structural uncertainty data points. Sensitivity analysis curve includes the addition of the following covariates: race, sex, and age. Gray curves indicate different combinations of selected covariates for the base case and sensitivity analyses, as well as the replacement of refractoriness to specific agents with the proportion of triple-class refractory patients. bela-maf: belantamab mafodotin; CI: confidence interval; HR: hazard ratio; ide-cel: idecabtagene vicleucel; KM: Kaplan–Meier; MAIC: matching-adjusted indirect comparison; OS: overall survival; PFS: progression-free survival.
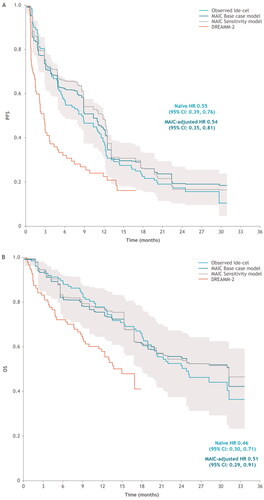
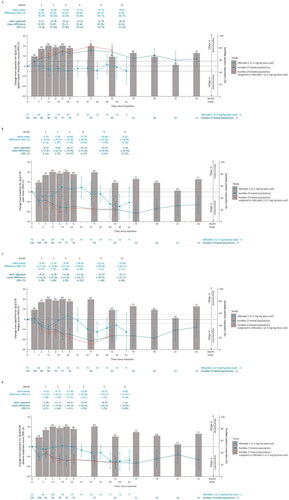
Figure 2. Observed and MAIC-adjusted change from baseline for (A) QLQ-C30 global health status/QoL score, (B) QLQ-C30 pain score, (C) QLQ-C30 fatigue score, and (D) QLQ-MY20 disease symptoms score for KarMMa ide-cel-treated population versus DREAMM-2 2.5 mg/kg bela-maf population over time. Restricted to time points with ≥10 patients. Change from baseline and 95% CIs are plotted. The x-axis includes information for both months and weeks. For KarMMa, bar charts are presented to note the percent of responders (patients who achieved stringent complete response (sCR), complete response (CR), partial response (PR), or very good partial response (VGPR)) at each time point of evaluation. Horizontal dotted lines indicate MID for improvement/deterioration. Bolded mean difference scores (naïve and MAIC-adjusted) are indicative of statistical significance. bela-maf: belantamab mafodotin; CI: confidence interval; EORTC: European Organisation for Research and Treatment of Cancer; ide-cel: idecabtagene vicleucel; HRQoL: health-related quality of life; MAIC: matching-adjusted indirect comparison; MID: minimally important difference; N: number of patients; QLQ-C30: EORTC Quality of Life Questionnaire C30 – general cancer; QLQ-MY20: EORTC Quality of Life Questionnaire Multiple Myeloma 20 – multiple myeloma specific; QoL: quality of life.
Supplemental Material
Download PDF (361.6 KB)Data availability statement
Bristol Myers Squibb details the data sharing process via the following website: https://www.bms.com/researchers-and-partners/independent-research/data-sharing-request-process.html