
Figures & data
Table 1. Clinical and demographic characteristics of the overall cohort.
Figure 1. Survival probabilities of the overall AITL cohort. (A) Kaplan-Meier curve of overall survival of our AITL cohort. (B) AITL survival stratified according to IPI risk groups. (C) AITL survival stratified according to PIT risk groups. (D) AITL survival stratified according to PIAI risk groups.
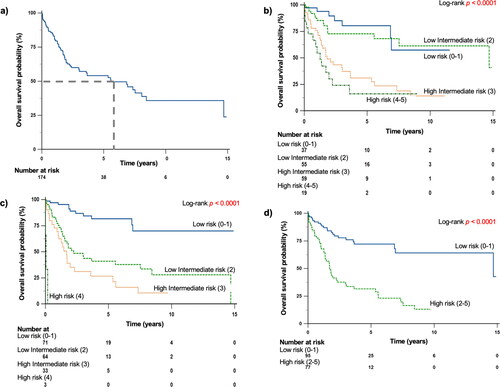
Table 2. Univariate analysis for overall survival and progression free survival.
Figure 2. Survival probabilities of patients. Overall survival as classified by (A) AITL prognostic index (B) with or without POD24.
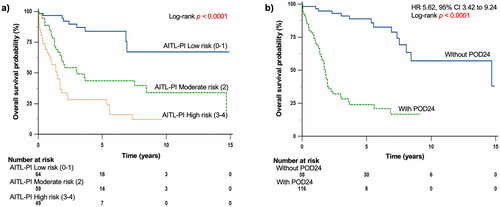
Table 3. Multivariate analysis for overall survival and progression free survival.
Table 4. Comparison of AITL prognostic index with other established prognostic indices.
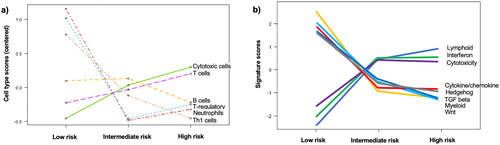
Figure 3. Gene expression analysis of patients. (A) Graphs showing gene expression profiling of immune cell types expressed in their raw scores in the AITL cohort stratified according to their risk groups using AITL Prognostic index and (B) Graph showing gene expression analysis of immune cell signaling pathway scores in the AITL cohort stratified according to their risk groups using AITL Prognostic index.
Supplemental Material
Download Zip (345.2 KB)Data availability statement
The datasets created and analyzed during this study are available from the corresponding author at [email protected] upon reasonable request.