Figures & data
Figure 1. Pola-resistant SU-DHL-4 cells were resistant due to increased expression of MDR1. A, Sensitivity to Pola at the indicated concentrations was assessed in SU-DHL-4 and SU-DHL-4-Pola-R cells. Data points represent mean value + SD. n = 3 B, Sensitivity to Pola at the indicated concentrations was assessed in SU-DHL-4 cells and SU-DHL-4-Pola-R cells cultured in Pola-free media for 1 week following treatment with Pola (1 µg/mL) for 1 week. Data points represent mean value + SD. n = 3 C, Sensitivity to Pola was assessed at the indicated concentrations in SU-DHL-4 cells and SU-DHL-4-Pola-R cells cultured in Pola-free media for 4 weeks following the treatment with Pola (1 µg/mL) for 1 week. Data points represent mean value + SD. n = 3 D, E, Surface expression of CD79b (D) or MDR1 (E) on SU-DHL-4 cells, SU-DUL-4-Pola-R-2 cells, and SU-DUL-4-Pola-R-2 cells treated with Pola (1 µg/mL) for 1 week was analyzed by flow cytometry. F, SU-DUL-4-Pola-R-2 cells treated with Pola (1 µg/mL) for 1 week. Sensitivity to Pola was then assessed at the indicated concentrations in cells treated with verapamil. Data points represent mean value + SD. n = 3.
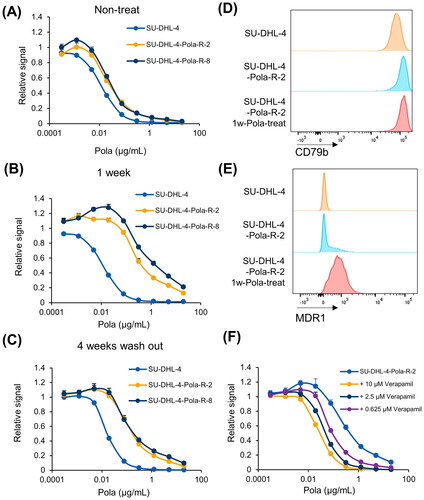
Figure 2. In vitro combination effect of Pola with Rit in SU-DHL-4-Pola-R cells. A, B, SU-DHL-4-Pola-R-2 cells treated with Pola (1 µg/mL) for 1 week were pretreated with Pola (A) or anti-CD79b antibody (SN8) (B) for 3 days at the indicated concentrations. Cells were then collected, and CDC assay was performed with Rit. The results are presented as mean values + SD. n = 3, * p < 0.05 by Dunnett’s t-test compared to control (Pola or SN8: 0 μg/mL). C, SU-DHL-4-Pola-R-2 cells were treated with Pola (1 µg/mL) for 1 week. Cells were then treated with Rit (30 min) followed by normal human serum (10 min). MAC (C5b-9 complex) binding was measured by flow cytometry. D, E, SU-DHL-4-Pola-R-2 cells treated with Pola (1 µg/mL) for 1 week were pretreated with Pola (D) or anti-CD79b antibody (SN8) (E) at 0.5 μg/mL for 3 days. Cells were then treated with Rit (0.05 μg/mL) for 30 min followed by normal human serum (10 min). MAC (C5b-9 complex) binding was measured by flow cytometry.
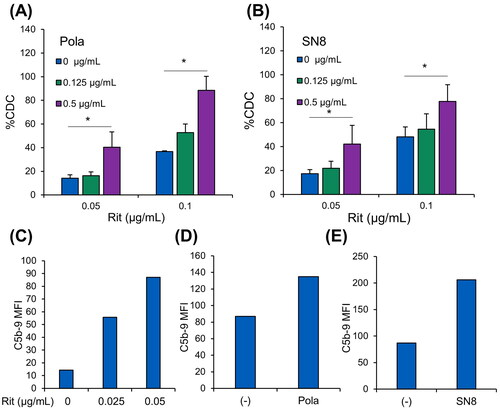
Figure 3. Pola-resistant STR-428 cells were resistant due to reduced expression of Bim. A, Sensitivity to Pola at the indicated concentrations was assessed in STR-428 and STR-428-Pola-R cells. Data points represent mean value + SD. n = 3 B, STR-428 and STR-428-Pola-R cells were treated with Pola (0.5 μg/mL) for 24 h, and cell lysates were then collected and evaluated by immunoblotting. C, STR-428 cells expressing shRNA targeting Bim (shBim) or control (shNC) were treated with Pola (0.5 μg/mL) for 24 h. Cell lysates were then evaluated by immunoblotting. D, Sensitivity to Pola at the indicated concentrations was assessed in cells expressing shRNA targeting Bim (shBim) or control (shNC). Data points represent mean value + SD. n = 3.
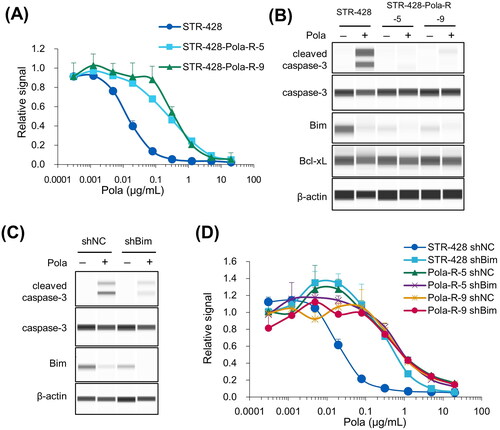
Figure 4. In vitro combination effect of Pola plus Rit in STR-428-Pola-R cells. A, B, Cells pretreated with Pola (0.5 μg/mL) (A) or MMAE (2 nM) (B) for 3 days were collected, and CDC assay was performed with Rit (0.04 μg/mL). The results are presented as mean values + SD. n = 3, * p < 0.05 by Student’s t-test. C, D, Surface expression of CD20 on cells pretreated with Pola (0.5 μg/mL) (C) or MMAE (2 nM) (D) for 3 days was analyzed by flow cytometry. E, F, STR-428-Pola-R cells were treated with Pola (0.5 μg/mL) (E) or MMAE (2 nM) (F) for 3 days. Cell lysates were then evaluated by immunoblotting. G, STR-428-Pola-R cells were pretreated with AZD5991 (20 μM) for 30 min before the assay. CDC assay was then performed with Rit (0.01 μg/mL). The results are presented as mean values + SD. n = 3, * p < 0.05 by Student’s t-test.
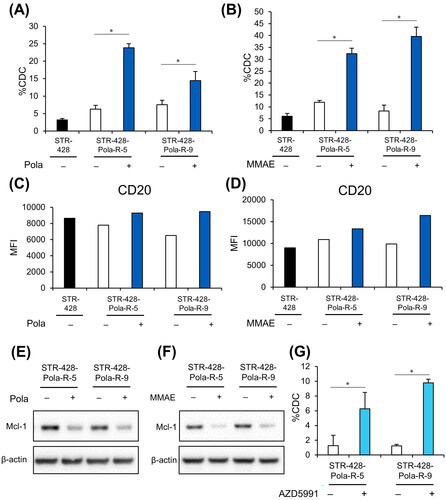
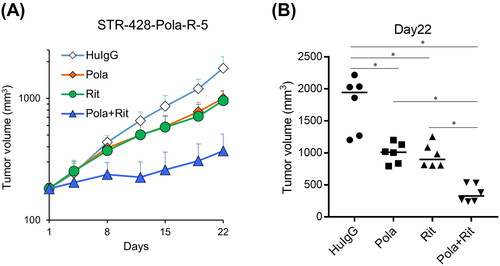
Figure 5. Combination efficacy of Pola plus Rit in the STR-428-Pola-R-5 xenograft model. A, B, SCID Mice bearing STR-428-Pola-R-5 cells were randomly divided into each group (n = 6/group). mice were treated with Pola (1 mg/kg), Rit (10 mg/kg), or Pola (1 mg/kg) plus Rit (10 mg/kg) on Day 1. As a control, HuIgG was administered. (A) Data points are mean + SD. (B) Tumor volumes measured on Day 22 are shown. Dots represent individual values and bars represent median. Statistically significant differences are shown as * p < 0.05 by Wilcoxon rank sum test with Holm-Bonferroni method applied.