
Figures & data
Figure 1. Patient attrition from FH database. 3L+: third or subsequent line of systemic therapy; ECOG: Eastern Cooperative Oncology Group; FH: Flatiron Health; FL: follicular lymphoma. aPatients were probabilistically sampled from an overall cohort of N = 207,263 patients with an ICD code for FL in the Flatiron Health network. bDefined as a regimen including at least one agent recommended by the NCCN Guidelines v4.2022 for the treatment of FL. cOf 158 patients, all had progression and/or survival data available but 33 did not have response data available in their index line of systemic therapy, resulting in N = 125 response-evaluable patients and N = 158 time-to-event evaluable patients.
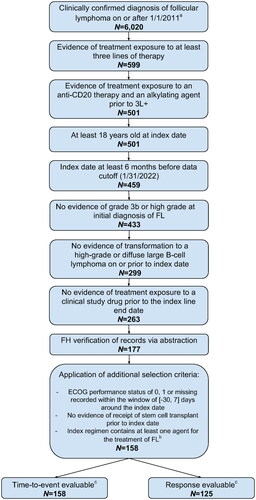
Table 1. Baseline demographic and clinical characteristics of patients from the mosunetuzumab and RWD cohorts, before (pre) and after (post) PSM weighting.
Figure 2. Weighted response rates in mosunetuzumab single-arm trial and real-world data cohorts. Bar plots show weighted complete and overall response rates by study cohort. Numbers above each bar correspond to the percentage of participants responding with 95% confidence intervals (also represented by the error bars).
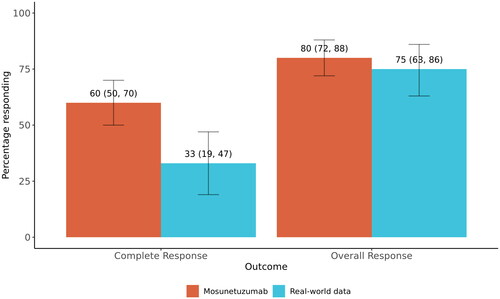
Figure 3. Forest plots of sensitivity analyses for (A) overall response rate, (B) complete response rate, (C) progression-free survival, and (D) overall survival. Each Forest plot shows the weighted association between study cohort and each outcome of interest, adjusting for months from diagnosis to index line initiation. Each row in the Forest plot corresponds to a separate sensitivity analysis conducted. The blue square represents the estimate (HR or or) while the horizontal line represents the 95% confidence interval. Upper or lower confidence limits that are outside the plot range are depicted with an arrow.
CI: confidence interval; HR: hazard ratio; I/E: inclusion/exclusion criteria; LoT: line of therapy; M: mosunetuzumab; OR: odds ratio; SS: sample size.

Table 2. Comparison of clinical outcomes between mosunetuzumab and RWD cohorts.
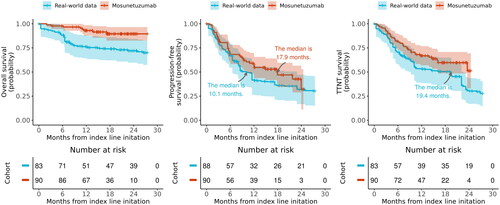
Figure 4. Weighted Kaplan-Meier plots comparing mosunetuzumab single-arm trial to RWD for (A) overall survival, (B) progression-free survival, and (C) time-to-next treatment. Solid lines represent Kaplan-Meier survival probabilities; shading represents 95% confidence intervals. PFS: progression-free survival; RWD: real-world data; TTNT: time-to-next treatment.
Supplemental Material
Download MS Word (30.5 KB)Data availability statement
Qualified researchers may request access to individual patient level data through the clinical study data request platform (https://vivli.org/). Further details on Roche’s criteria for eligible studies are available here (https://vivli.org/members/ourmembers/). For further details on Roche’s Global Policy on the Sharing of Clinical Information and how to request access to related clinical study documents, see here: (https://www.roche.com/research_and_development/who_we_are_how_we_work/clinical_trials/our_commitment_to_data_sharing.htm).