
Figures & data
Table 1. Baseline characteristics.
Figure 1. Unadjusted progression-free survival Kaplan-Meier curves among lenalidomide-exposed patients. DPd: daratumumab plus pomalidomide and dexamethasone; ITT: intention to treat; KdD: carfilzomib, dexamethasone, and daratumumab; PFS, progression-free survival; PVd, pomalidomide, bortezomib, and dexamethasone.
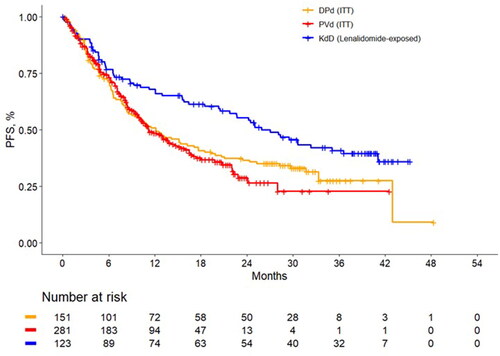
Figure 2. Landmark analyses at 6-, 12-, 24- and 36-month timepoints and progression-free survival Kaplan-Meier curves for the matched population for KdD (lenalidomide-exposed subgroup) and PVd (full trial population). HR: hazard ratio; ITT: intention to treat; KdD: carfilzomib, dexamethasone, and daratumumab; PFS: progression-free survival; PVd: pomalidomide, bortezomib, and dexamethasone.
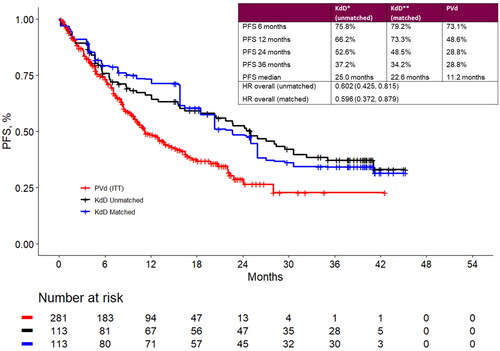
Table 2. Summary results for base-case and scenario matching-adjusted indirect treatment comparison analyses.
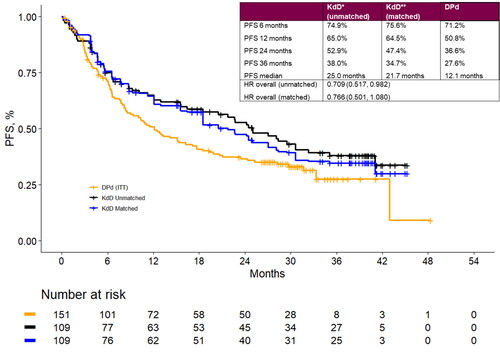
Figure 3. Landmark analyses at 6-, 12-, 24- and 36-month timepoints and progression-free survival Kaplan-Meier curves for the matched population for KdD (lenalidomide-exposed subgroup) and PVd (full trial population). DPd: daratumumab plus pomalidomide and dexamethasone; HR: hazard ratio; ITT: intention to treat; KdD: carfilzomib, dexamethasone, and daratumumab; PFS: progression-free survival.
Supplemental Material
Download Zip (160 KB)Data availability statement
Qualified researchers may request de-identified data from Amgen clinical studies. Complete details are available at the following: http://www.amgen.com/datasharing.