
Figures & data
Table 1. Demographic and disease characteristics.
Table 2. Summary of DLTs.
Figure 1. Mean pelabresib plasma profiles (semi-logarithmic scale). A) Mean pelabresib plasma profile over time at cycle 1 day 1. B) Mean pelabresib plasma profile over time at cycle 1 day 14.
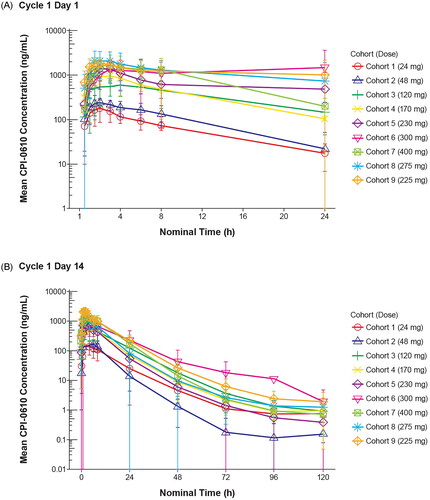
Table 3. Treatment-emergent adverse events by relationship to study drug (incidence ≥10% of patients overall; safety population).
Supplemental material
Supplemental Material
Download MS Word (106.2 KB)Data availability statement
Data sharing requests by qualified researchers pertaining to the MANIFEST phase 1 study will be considered only for noncommercial use on a case-by-case basis (to be approved by MorphoSys; [email protected]), starting 12 months from acceptance of the manuscript and until 36 months thereafter; approval may be subject to a data access agreement.