
Figures & data
Table 1. Patient characteristics in trALL and dnALL.
Figure 1. Outline of primary cancer treatment, latency to trALL, and cytogenetic abnormalities. Gray shading indicates failed karyotype. * T-lymphoblastic phenotype.
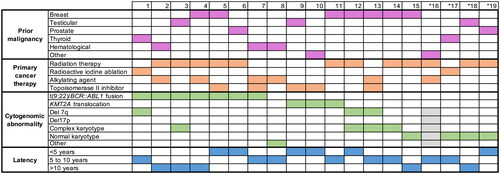
Figure 2. Oncoplot for visualization of mutations in trALL each column represents a patient sample and each row a different gene. The bottom barplot shows the corresponding cytogenetic and immunophenotypic profile. Percentages are rounded to 5% increments. Chr chromosome NA not available Ph Philadelphia chromosome TMB total mutation burden.
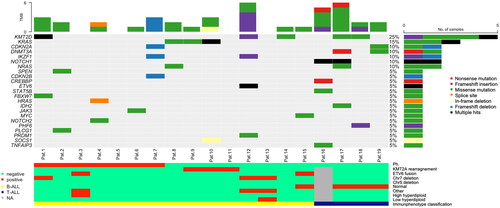
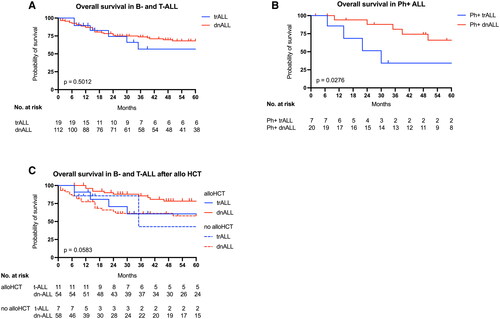
Figure 3. Overall survival in trALL shown are Kaplan–Meier plots for overall survival in trALL and dnALL (A) and in the subgroups of Philadelphia chromosome-positive trALL and dnALL (B). Overall survival in patients with and without allogeneic stem cell transplantation is depicted in C. Plots are calculated as the time to death or lost to follow-up, and p values are calculated by the log-rank test. Tick marks indicate censored data.
Supplemental Material
Download MS Excel (18.4 KB)Data availability statement
A dataset on all trALL patients is provided in the supplementary material. Further requests for data sharing may be submitted to Corinne C. Widmer ([email protected]).