
Figures & data
Table 1. Baseline demographics.
Table 2. Overall response.
Figure 1. PFS KM curves as assessed by the IRC. IRC: independent review committee; KM: Kaplan-Meier; KPd: carfilzomib, pomalidomide, and dexamethasone; NE: not estimable; PFS: progression-free survival.
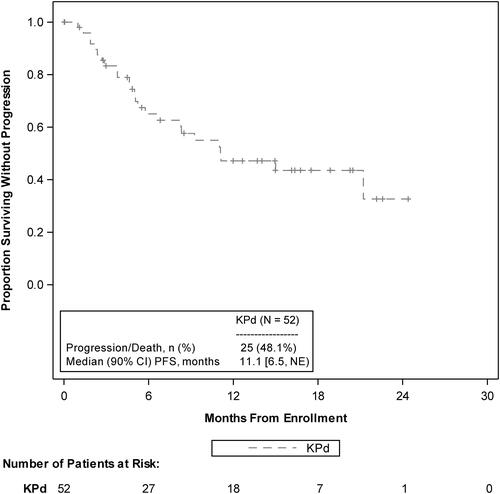
Figure 2. OS KM curves. KM: Kaplan-Meier; KPd: carfilzomib, pomalidomide, and dexamethasone; NE: not estimable; OS: overall survival.
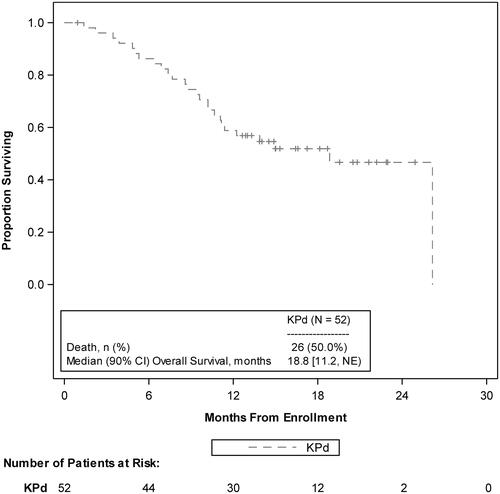
Table 3. TEAEsTable Footnote* of interest by preferred term.
Table 4. Serious TEAEs.Table Footnote*
Supplemental material
Supplemental Material
Download MS Word (68.6 KB)Data availability statement
Qualified researchers may request data from Amgen clinical studies. Complete details are available at the following: http://www.amgen.com/datasharing.