
Figures & data
Table 1. List of attributes and levels.
Table 2. Sample descriptive characteristics.
Table 3. Results of the DCE.
Figure 1. WTP estimates (€/month) for changes in attributes’ levels.
Note. Non-significant results are reported with a striped pattern. Grey bars represent the 95% confidence intervals.
Abbreviations: n.s.: not significant
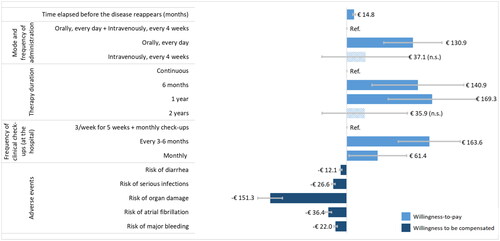
Figure 2. Levels ranking according to WTP estimates (€/month).
Note. Non-significant results are reported with a striped pattern.
Abbreviations: IV: intravenuous. m: month. n.s.: not significant. y: year. PO: oral. w: week.
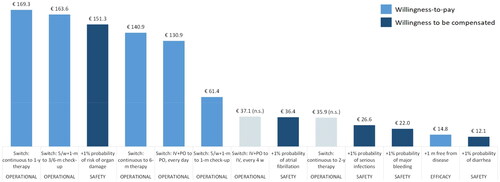
Table 4. Example of WTP calculation for treatment switch (€/month).
Supplemental material