Figures & data
Table 1. Variables: descriptive statistics.
Table 2. Aggregate measures of open innovation across industries and countries.
Figure 1. Industries in the breadth-depth open innovation space. in Appendix provides a description of sector codes.
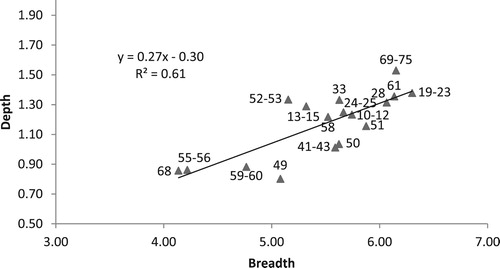
Figure 2. European countries in the breadth-depth open innovation space. in the Appendix provides a description of country codes.
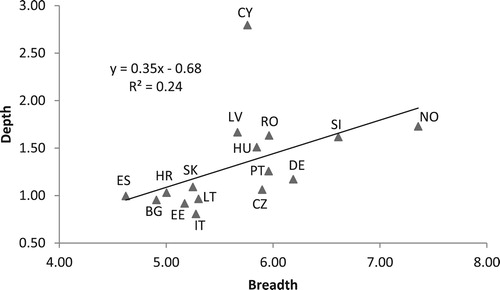
Table 3. Variables: correlation matrix.
Table 4. Initial equations estimating drivers of innovation, product innovation, and process innovation.
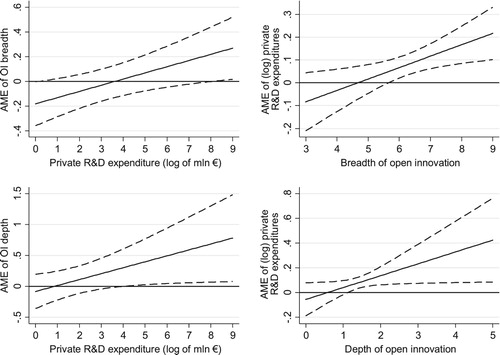
Figure 3. Average marginal effects of R&D expenditures and open innovation on value added with 95% confidence intervals.