
Figures & data
Table 1. GBARD/(GERD-BERD).
Figure 1. Natural logarithms of data for Japan with slopes as growth rates.
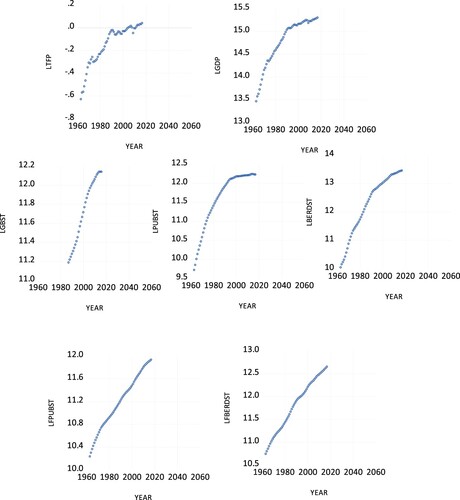
Figure 2. Effects of a permanent change of 0.005 (accumulated sum of the impulse responses) on public R&D stock in the VECM until 2050. The first graph indicates the type and size of the shock. The left axes measure differences to baseline at the lower curve. The right-hand axes measure levels of the shock scenario, baseline, and actuals at the higher set of curves. Confidence intervals are for policy scenarios. Their shift is roughly the same as that from baseline and therefore the lines are on each other.
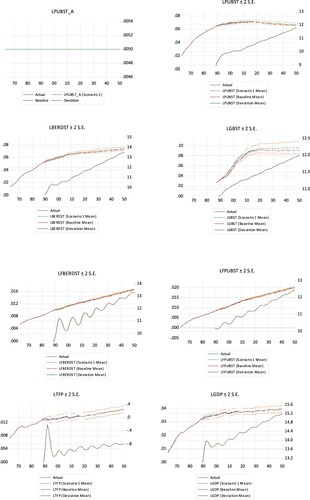
Figure 3. Effects of a permanent intercept change of 0.005 (accumulated sum of the impulse responses) on GBARD stock in the VECM until 2050. Other information as in .
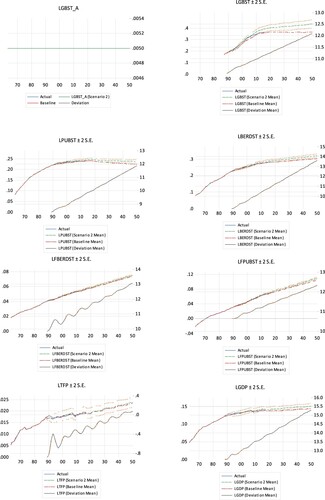
Figure 4. Effects of a permanent shock of 0.005 (accumulated sum of the impulse responses) on private R&D stock in the VECM until 2050. Other information as in .
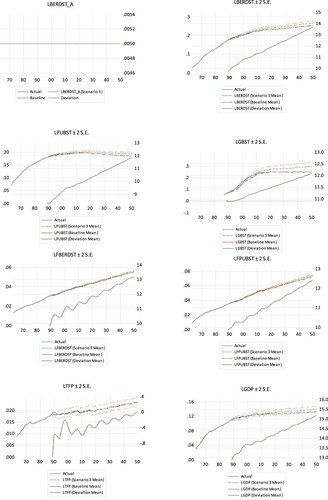
Table 2. Effects from shocks on public R&D, GBARD, and private R&D: Percentage difference from baseline averaged from 1989 to 2050.
Table 3. Net gains, DPV, and internal rates of return (IRR) to additional public R&D, GBARD, and private R&D.
Table A.1. Pairwise Johansen cointegration tests, p-values.
Table A.2. Data description of small sample of 7 European countries 1963–2017.
Table A.3. Data description of sample of 14 European countries 1963–2017.