
Figures & data
Table 1. Major national broadband/NBN programs introduced in 34 OECD states until 2018.
Table 2. Summary statistics.
Figure 1. NBN investment and adoption household shares (OECD mean values for 2003–2019). Source: Own calculations based on data from FTTH Council Europe.
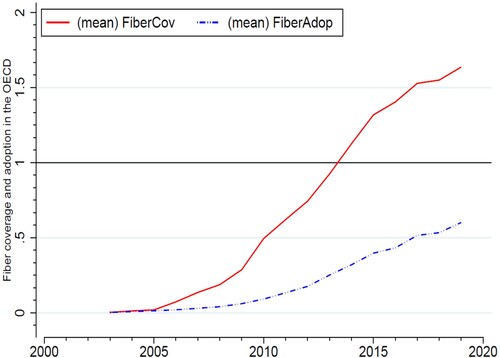
Table 3. Main estimation results.
Table 4. Tests and robustness checks.
Table 5. State aid expenditures on NBN.
Table A1. Variable descriptions and sources.
Table A2. National NBN state aid programs in OECD member states imposed during 2002–2019.
Table A3. Further robustness checks.
Table A4. First-stage results.