Publication Cover
Policing and Society
An International Journal of Research and Policy
Volume 33, 2023 - Issue 7
2,683
Views
0
CrossRef citations to date
0
Altmetric
Research Articles

The foundations of defiance: examining the psychological underpinnings of ethnic minority defiance toward police

ORCID Icon, ORCID Icon & ORCID Icon
Pages 802-819 | Received 18 Nov 2022, Accepted 03 Apr 2023, Published online: 18 Apr 2023

Figures & data

Figure 1. Integrated theoretical model.

Figure 1. Integrated theoretical model.

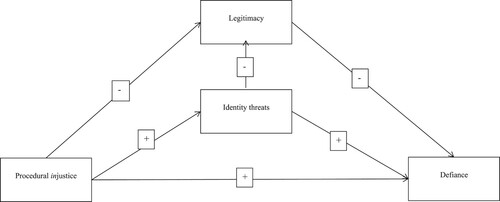
Table 1. Factor analyses.

Figure 2. Path analysis with unstandardised estimates and bootstrapped standard errors.

Note: N = 790; Error covariance of resistance and disengagement and of status and moral-democratic identity threats are not depicted. Non-significant paths tested in the final model are represented by broken lines. Ethnic group (1 = Middle Eastern Muslim, 0 = Vietnamese); Gender (1 = female, 0 = male); Police contact (1 = police contact in past 2 years, 0 = no police contact). Coefficients calculated with bootstrapped standard errors (1000 replications). Significance levels shown here are for the unstandardised solution ***p ≤ .001; **p ≤ .01; *p ≤ .05. Coefficients are rounded to 2 decimal places.

Figure 2. Path analysis with unstandardised estimates and bootstrapped standard errors.Note: N = 790; Error covariance of resistance and disengagement and of status and moral-democratic identity threats are not depicted. Non-significant paths tested in the final model are represented by broken lines. Ethnic group (1 = Middle Eastern Muslim, 0 = Vietnamese); Gender (1 = female, 0 = male); Police contact (1 = police contact in past 2 years, 0 = no police contact). Coefficients calculated with bootstrapped standard errors (1000 replications). Significance levels shown here are for the unstandardised solution ***p ≤ .001; **p ≤ .01; *p ≤ .05. Coefficients are rounded to 2 decimal places.

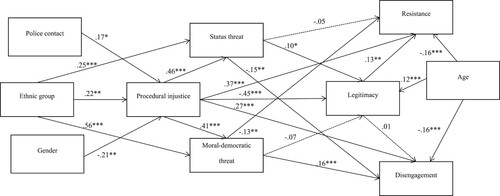
Table 2. Pearson’s correlation coefficients.

Table 3. Goodness-of-fit statistics.

Table 4. Path analysis direct, indirect and total effects, unstandardised coefficients.

Table 5. Partitioning indirect effects for key pathways, unstandardised coefficients.