
Figures & data
Table 1. Number of barring notices (BN) served each year: 2011-2020.
Table 2. Number of recorded offences, by offence category.
Table 3. Location of recorded offences, by overall location type and sub-category: 2007–2020.
Figure 1. Recorded assault offence numbers, by location type: 2007–2020 (the vertical line indicates the introduction of barring notices).
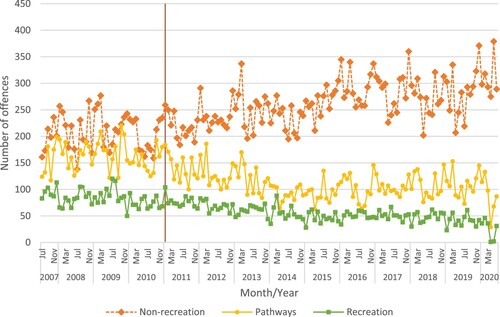
Table 4. Time series models for total count of offences, by location type: 2007–2020.
Figure 2. Recorded offence numbers within recreation locations, by assault category: 2007–2020 (the vertical line indicates the introduction of barring notices).
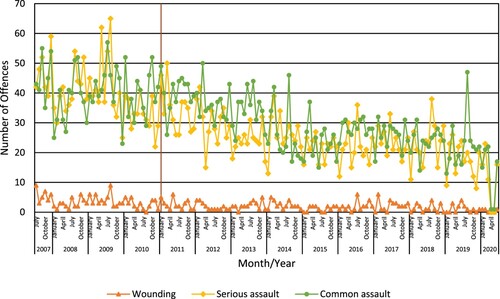
Table 5. Time series models for offences recorded within recreation locations: 2007–2020.
Figure 3. Recorded offence numbers, by assault category: 2007–2020 (the vertical line indicates the introduction of barring notices).
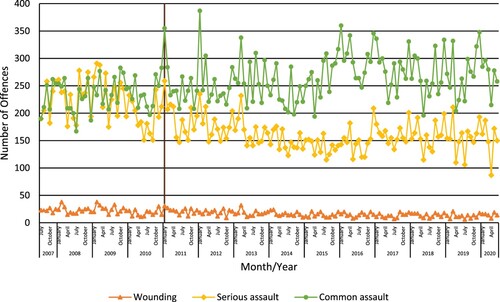
Table 6. Time series models for total count of offences: 2007–2020.
Figure 4. Recorded assault offence numbers, by family/non-family incident type: 2007–2020 (the vertical line indicates the introduction of barring notices).
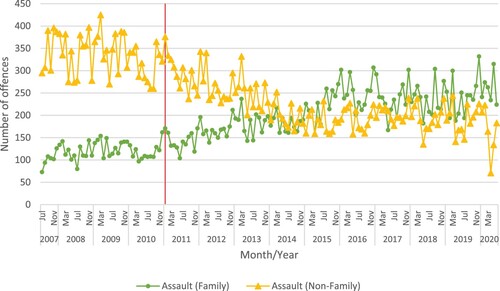
Table 7. Time series models for total count of offences, by family/non-family incident type: 2007–2020.
Figure 5. Recorded alcohol involved offence numbers, by assault category: 2007–2020 (the vertical line indicates the introduction of barring notices).
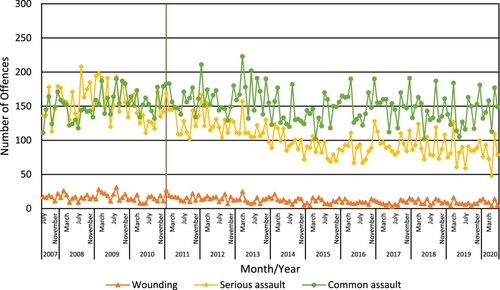
Table 8. Time series models for assault offences recorded with an alcohol flag: 2007–2020.
Table 9. Total number of recorded assault offences by family/non-family Type: 2007–2020
Figure 6. Recorded offence numbers, excluding family cases, by assault category: 2007–2020 (the vertical line indicates the introduction of barring notices).
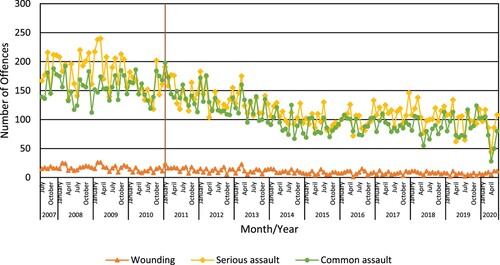
Table 10. Time series models for assault offences recorded excluding family cases: 2007–2020.
Figure 7. Recorded alcohol involved assault offences, by family/non-family type: 2007–2020 (the vertical line indicates the introduction of barring notices).
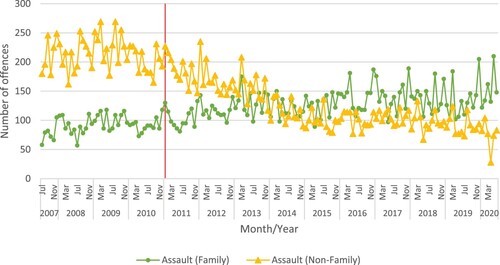
Table 11. Time series models for total count of alcohol involved offences, by family/non-family type: 2007–2020.
Table 12. Time series models for assault offences recorded in Perth: 2007 – 2020.
Table 13. Time series models for assault offences recorded in Fremantle: 2007–2020.
Table 14. Time series models for alcohol flagged assault offences recorded in Perth: 2007–2020.
Table 15. Time series models for alcohol flagged assault offences recorded in Fremantle: 2007–2020
Table 16. Time series models for assault offences with family cases removed, recorded in Perth: 2007–2020.
Table 17. Time series models for assault offences with family cases removed, recorded in Fremantle: 2007 –2020.
Supplemental Material
Download MS Word (14.3 KB)Data availability statement
The datasets analysed during the current study are not publicly available as the data is held by WA Police.