Figures & data
Figure 1. Design process translating reflective search model into a service that balances the fluency-consistency tradeoff.
Figure 2. Associative hierarchy as a mutual dependence of N (asymptotic number of topic-related associations) and λ (rate of approach to N).
Figure 3. Artifact-mediated mutual stimulation causes associative hierarchy to be flatter after a collaborative than individual information search.
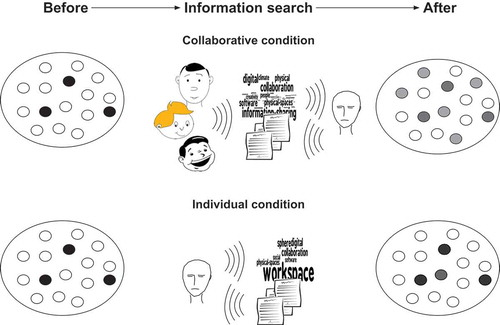
Figure 4. Bookmarking interface to collect a Web resource (number 1), classify it by choosing from a list of pre-defined topics (number 2), receive a set of recommended tags, denoted WREC (number 3), and make a tag assignment (number 4).
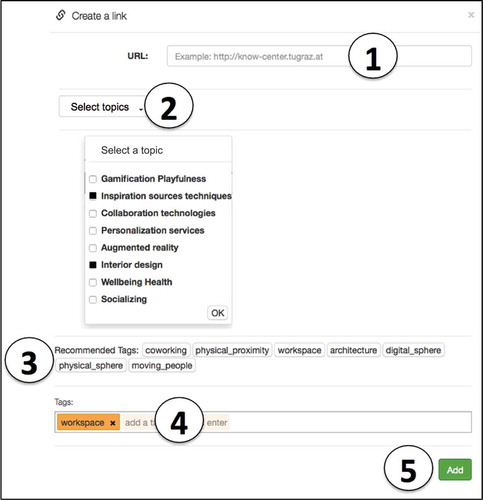
Figure 5. Cumulative free association latency distribution. Error bars represent 1 standard error of mean.
Table 1. Best-fitting parameter estimates of association latency distributions.
Table 2. Summary of the regression of SW (tag similarity of a bookmark pair) on ST (the pair’s topical similarity) and ‘Search Condition’.
Figure 6. Strength of tag-topic relationship (left diagram, Figure 6a) and semantic distinctiveness (right diagram, Figure 6b) as a function of “Search Condition” (Individual vs. Collaborative). Error bars represent 1 standard error of mean.
Figure 7. Bookmarking interface (left-hand side) and schematic illustration of the algorithm generating the set of recommended tags WREC (right-hand side).
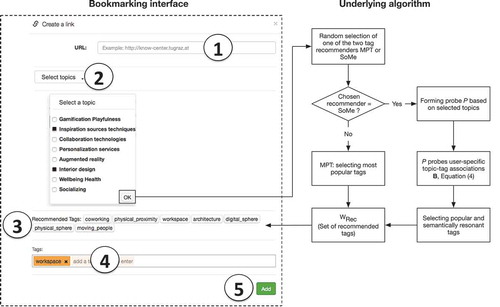
Figure 8. Tag acceptance rate achieved by the MPT and SoMe for a varying number of recommended tags (x = 1,…,7) under the individual (left, Figure 8a) and collaborative search (right, Figure 8b). Error bars represent 1 standard error of mean.