
Figures & data
Table 1. Summarized literature review findings of motivational background in online volunteering and voluntary contribution platforms.
Figure 1. Motivation spectrum showing various types of motivations in an increasing degree of self-determination and varying source of regulation.
Figure 2. OSPIA interview interface from the perspective of the simulated patient.
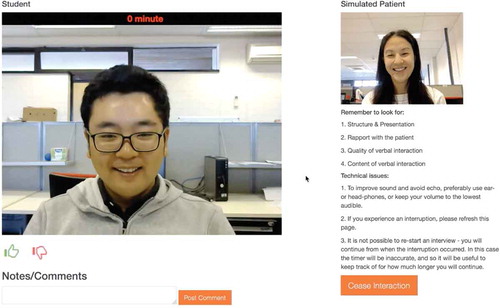
Figure 3. Artifacts from affinity diagramming with simulated patients in workshop 1.
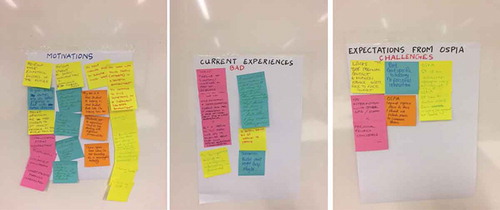
Table 2. Demographics – attendance mode and gender distributions for participants in online survey.
Table 3. Demographics – employment status distribution.
Table 4. Results comparing basic descriptive statistics and Mann–Whitney values of SDT constructs and motivation of online and campus SPs.
Table 5. Correlations for need satisfaction and motivations of the campus SPs.
Table 6. Correlations for need satisfaction and motivations of the online SPs.
Table 7. Hypotheses tested in study 2.
Figure 4. Weekly acknowledgment e-mail received by the sp in the baseline phase.
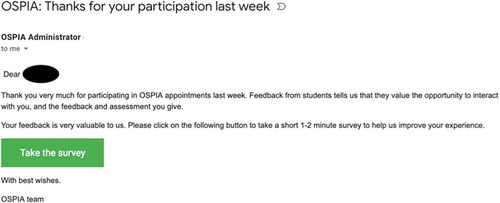
Figure 5. Prompt to book more appointments.

Figure 6. Weekly acknowledgment e-mail received by the sp in the intervention phase.
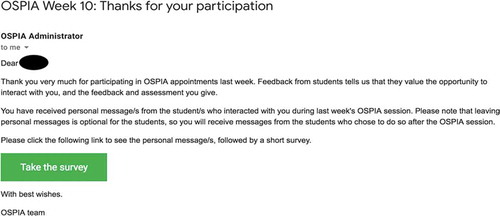
Figure 7. Chronology of intervention phase events.
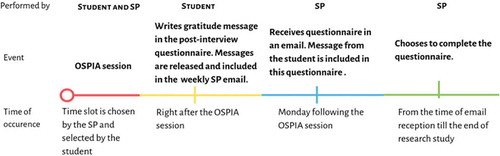
Table 8. Number of appointments booked, number of appointments completed, number of survey submissions by the SPs in the baseline and intervention phases.
Table 9. Correlation summary for survey response variables of study 2 intervention phase.