
Figures & data
Figure 1. Popularity of search terms “virtual reality” (1a) and “Augmented Reality” (1b), Implying a resurgence of interest in VR ca. 2015 and a Growing Interest in AR ca. 2011. (Peak popularity is assigned 100, 50% of this peak is assigned 50, etc.).
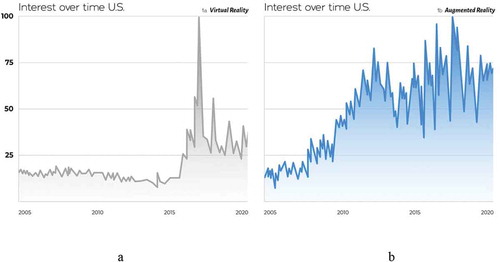
Table 1. XR headset sales by type.
Figure 2. Google scholar articles per year from 1998–2019, showing AR closing the gap with VR.
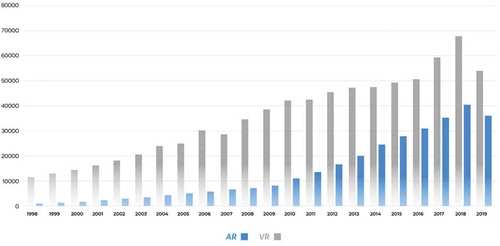
Figure 3. Popularity of search terms “Cybersickness” (3a) and “Simulator Sickness” (3b), implying a resurgence of interest specific to Cybersickness, ca. 2015, around the same time interest in XR Increased (see , and Dunn, Citation2017). (100 = peak interest, 50 = 50% peak, etc.).
Figure 4. Assessing the sensitivity to motion in depth under different cue conditions* (Adapted from Fulvio, Ji, & Rokers, Citation2020). * a) Observers viewed random dot motion stimuli in an Oculus DK2 head-mounted display (HMD). The stimuli simulated dots that moved toward or away from the observer through a cylindrical volume. The proportion of signal dots (coherence), which moved coherently either toward or away, and noise dots, which moved randomly through the volume, was varied in a random, counterbalanced order across trials. Observers reported the perceived motion direction. Stimuli were presented in a virtual environment that consisted of a room (the insert depicts a “zoomed out” view) with a 1/f noise-patterned plane located 1.2 m from the observer. b) Dot motion was defined by one of four sets of sensory cues, presented in a randomized blocked order. Binocular dot motion contained binocular cues to depth (i.e., changing disparity, inter-ocular velocity), but lacked monocular cues to depth (i.e., dot density and size changes). Monocular dot motion contained monocular cues to depth but lacked binocular cues. Combined cues dot motion contained both binocular and monocular cues. Full VR dot motion contained binocular and monocular cues and motion parallax cues associated with head-motion contingent updating of the display. c) Psychometric functions were fit to the percentage of “toward” responses at each motion coherence level to obtain the slope (σ) of the fit for each observer in each cueing condition. Sensitivity in each cueing condition was defined as the inverse of the slope, with larger values indicating greater sensitivity. d) Histograms of the distribution of sensitivities across observers in each of the four cueing conditions reveal considerable variability both within and across conditions. Sensitivity tends to be greater in combined cue conditions compared to when cues are presented in isolation.
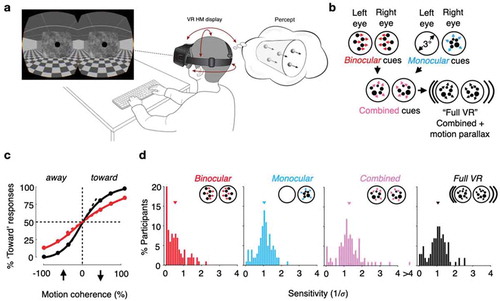
Figure 5. Sensory cue sensitivity predicts cybersickness severity* (Adapted from Fulvio, Ji, & Rokers, Citation2020). * a) After viewing binocular, head-fixed video content in the VR HMD, observers reported significantly greater levels of cybersickness compared to baseline reports obtained at the beginning of the study. However, sickness-inducing effects of the video content were highly-variable among observers, with some individuals appearing to be relatively immune to cybersickness. b) Change in motion sickness as a function of sensory cue sensitivity. Observers’ sensitivity to the Full VR dot motion predicted their susceptibility to cybersickness with video viewing. The relationship was not significant in the other cue conditions. This suggests that sensitivity to motion parallax cues in particular is an important factor susceptibility to cybersickness.
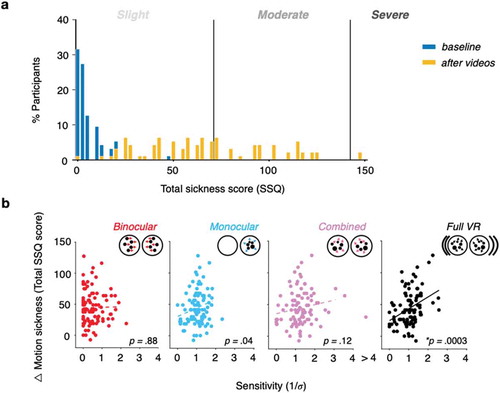
Table 2. Potential cybersickness mitigation strategies implied by different etiological hypothesis.
Figure 6. (a) Principal component (PC) loadings for each predictor*; b) Negative correlation between postural sway during vection, and cybersickness (ΔCS) (Adapted from Weech et al., Citation2018b). * Percentage values on left indicate the amount of variance in cybersickness scores accounted for by each PC; Percentage values on the bottom indicate the amount of unique variance in cybersickness scores accounted for by each predictor. Darker colors depict higher loadings, representing a greater expression of that factor on the PC. MSSQ = Motion Sickness Susceptibility Questionnaire score; EOF = Eyes Open Foam condition sway path length (SPL); ECF = Eyes Closed Foam condition SPL; V = Vection condition SPL; EOS = Eyes Open Standard condition SPL; ECS = Eyes Closed Standard condition SPL; VStr = Vection Strength ratings; Thresh = Vestibular Thresholds.
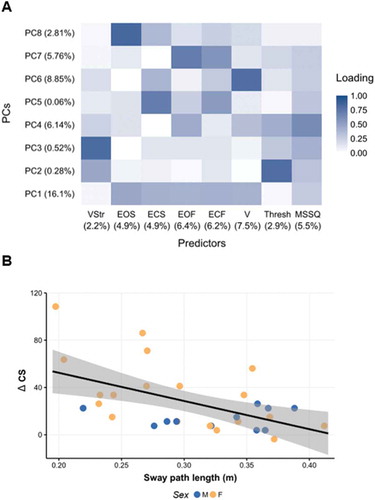
Table 3. Recommended R&D Agenda to resolve cybersickness (update of Stanney et al., Citation1998).