
Figures & data
Table 1. Different types of warning apps and their classification
Figure 1. Categorization of warning apps according to market spread and functionality – bubble size correlates with download numbers
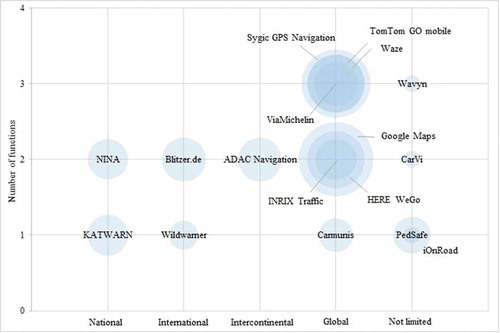
Table 2. Scenario partitioning depending on the HCI
Table 3. Evaluation of scenarios II and III for the classified warning apps
Figure 2. User interactions due to the scenarios I, II and III of driving automatization levels
Figure 3. Frequency of usage
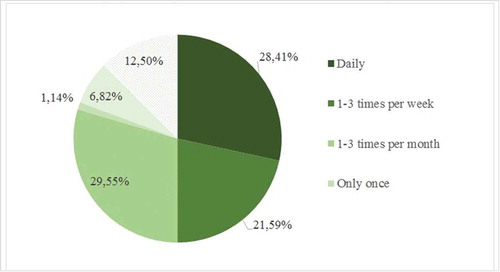
Figure 4. Driving behavior in case of a warning
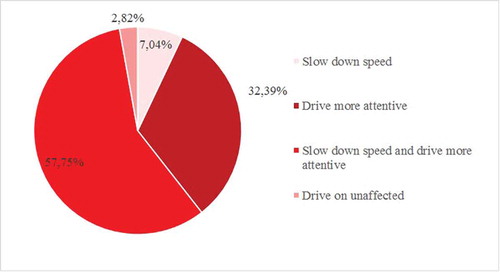
Figure 5. Frequency of usage combined with the perception about the amount of received warnings*
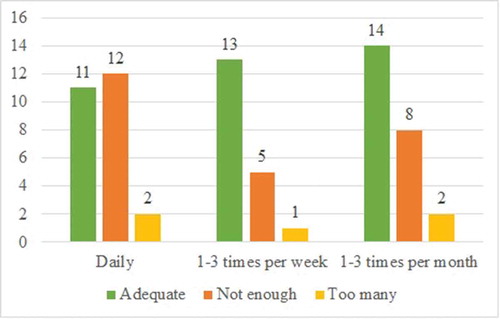
Table 4. Results of Q5: In which warning source the app users have the highest trust in
Table 5. Applicability and success evaluation for the selected Business Models for warning services for autonomous driving