Figures & data
Figure 1. Flight envelope, velocity (V) versus load factor (n)
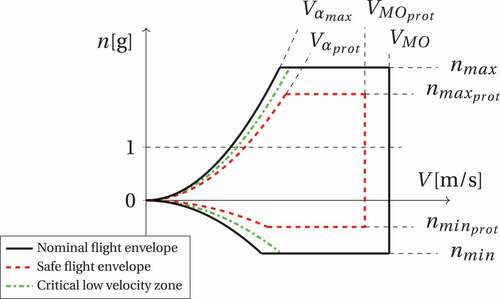
Figure 2. Haptic profile: force required on the side stick versus deflection
Figure 3. Simulators used in the evaluations
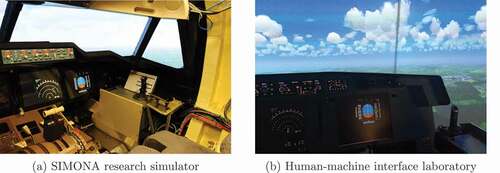
Figure 4. Flight path side-view, solid black vertical lines indicate “fly-through gates” shown on the outside visual; the thick red line indicates the trigger point of the windshear (not shown on the outside visual); the dotted blue lines indicate the windshear section used in our evaluation
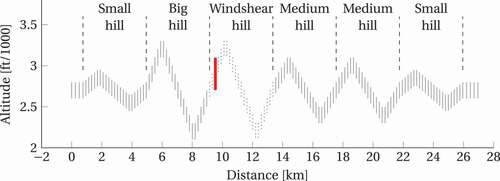
Figure 5. Example of the outside visual flight path visualization
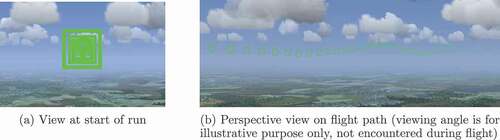
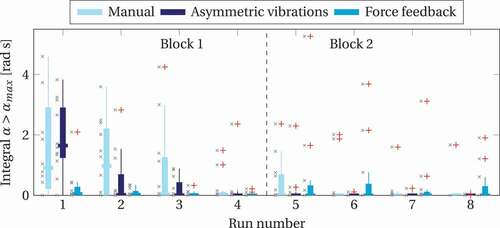
Figure 6. Integral of angle of attack above maximum value during windshear recovery for the concept with asymmetric vibrations, x’s indicate individual data points, summarized data is presented using box-plots where outliers are represented by red pluses, retrieved from Van Baelen et al. (Citation2020b)
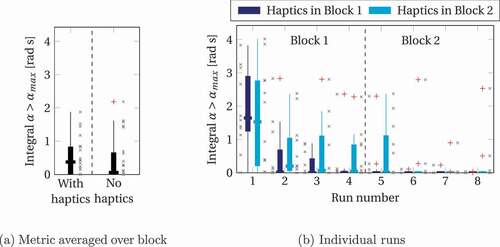
Figure 7. RSME for the concept with asymmetric vibrations, x’s indicate individual data points, summarized data is presented using box-plots where outliers are represented by red pluses, retrieved from Van Baelen et al. (Citation2020b)
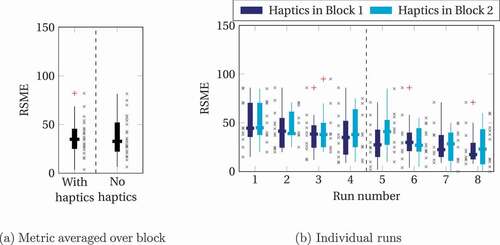
Figure 8. Situation awareness questions for the concept evaluation with asymmetric vibrations, x’s indicate individual data points, summarized data is presented using box-plots where outliers are represented by red pluses, retrieved from Van Baelen et al. (Citation2020b)
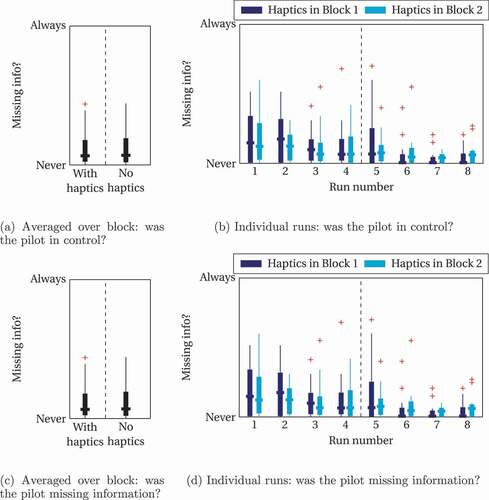
Figure 9. RSME for the concept evaluation with force feedback, x’s indicate individual data points, summarized data is presented using box-plots where outliers are represented by red pluses, retrieved from Van Baelen et al. (Citation2021)
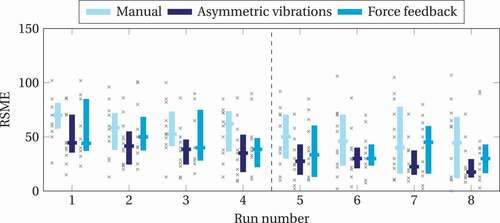
Figure 10. Situation awareness questions for the concept evaluation with force feedback, x’s indicate individual data points, summarized data is presented using box-plots where outliers are represented by red pluses, retrieved from Van Baelen et al. (Citation2021)
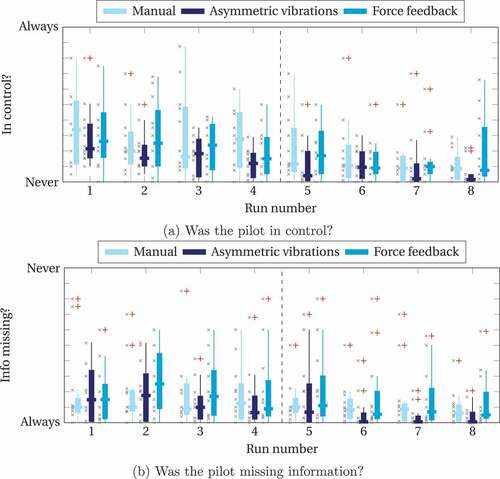
Figure 11. Integral above angle of attack limit during windshear (Manual Participant 7, , not shown) for the concept evaluation with force feedback, x’s indicate individual data points, summarized data is presented using box-plots where outliers are represented by red pluses, retrieved from Van Baelen et al. (Citation2021)