Figures & data
Figure 1. Number of confirmed cases in major UK cities (Centre for Cities, Citation2020).
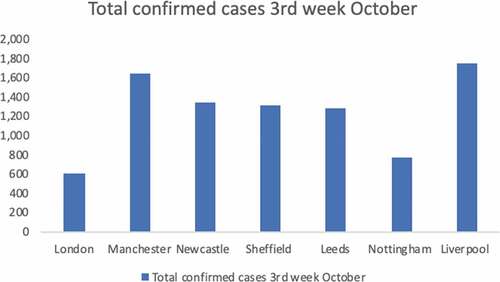
Figure 2. Percentage of amenities (usage) during the pandemic, UK. (Google Community Mobility Report, Citation2020).
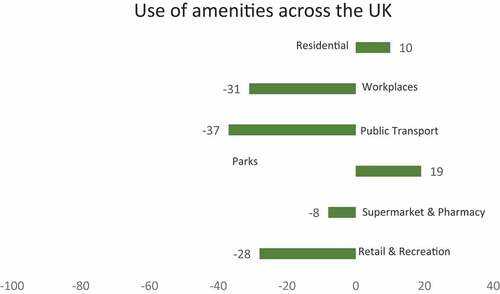
Figure 3. Selection of 4 UK cities; use of amenities retail, parks, and roads (Google Community Mobility Report, Citation2020).
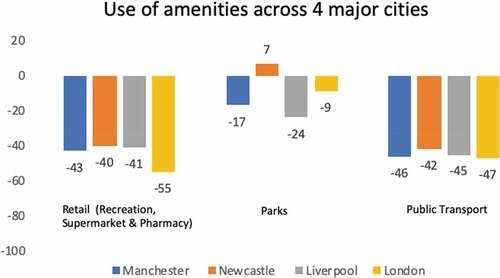
Figure 4. Trends of mobility in the UK before and during the pandemic (APPLE, Citation2020).
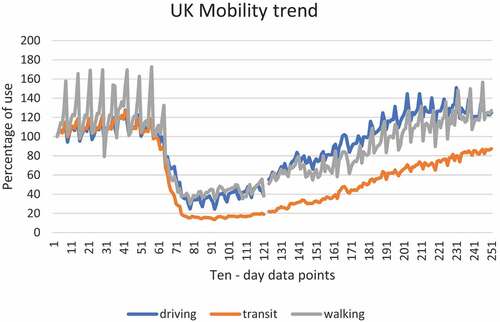
Figure 5. Trends of mobility in London before and during the pandemic (APPLE, Citation2020).
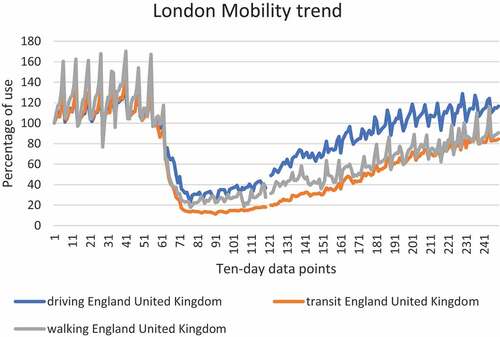
Figure 6. Percentage of UK companies in liquidation (FT2020).
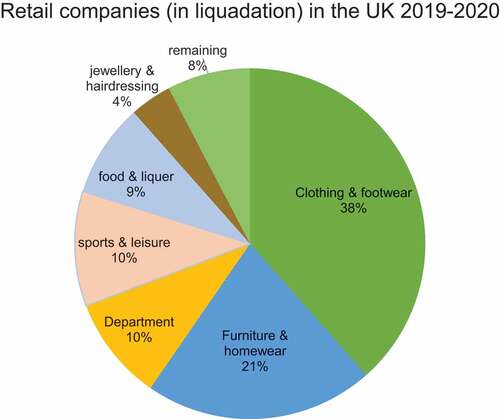
Figure 7. Highest retail earners during the pandemic (FT2020).
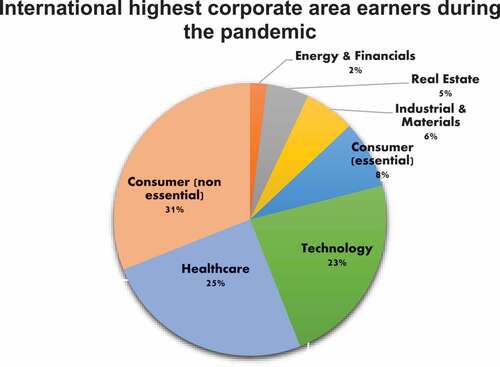
Figure 8. Smart assessment methodology (Cavada, Citation2019, adapted).
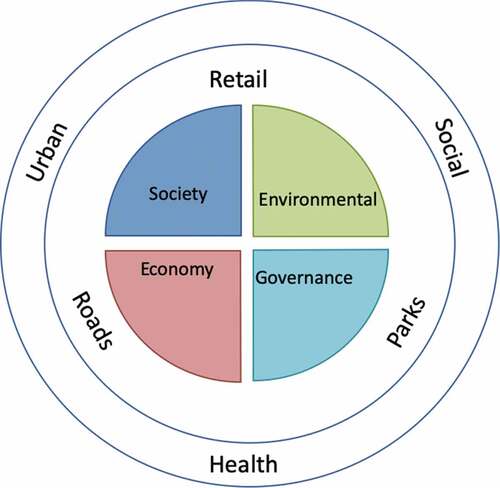
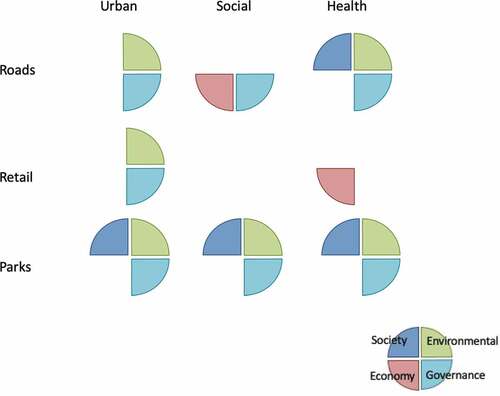
Figure 9. Assessment of the impact in Roads, Retail, and Parks using the four Lenses (key) from the lockdown restrictions.