Figures & data
Figure 1. Conceptual diagram of the intervention in real and virtual environments.
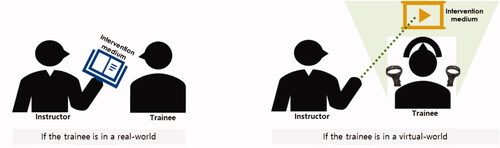
Table 1. Composition of procedures & sub-procedures of the VR barista training.
Figure 2. Examples of virtual interventions.
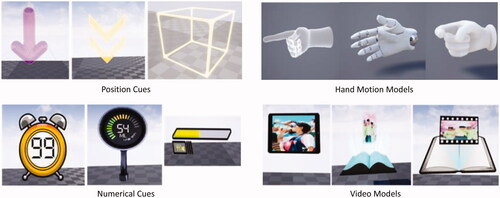
Figure 3. Example of virtual intervention content for each sensory type.
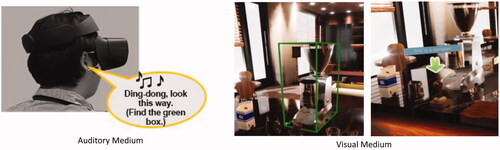
Figure 4. Example of diverse types to express visual position cues.
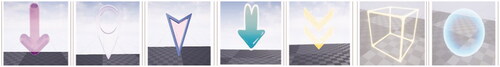
Figure 5. Virtual intervention content controlled by an instructor.
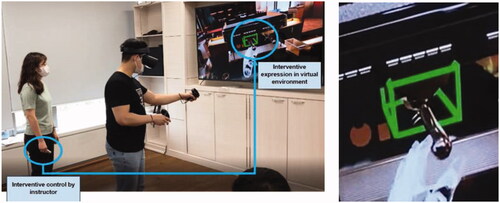
Figure 6. Example of visual cue and video modelling.
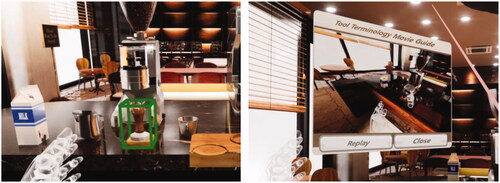
Figure 7. Experimental environment & data collection screen.
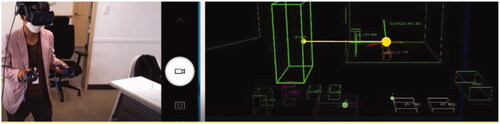
Figure 8. Correlation between the efficiency of cues and success rate of video intervention.
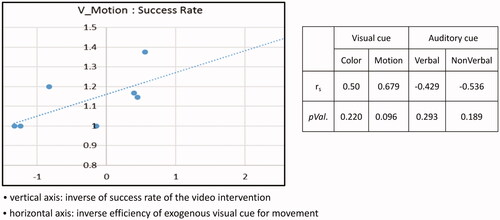
Figure 9. Experiment II procedure with four measurement steps.
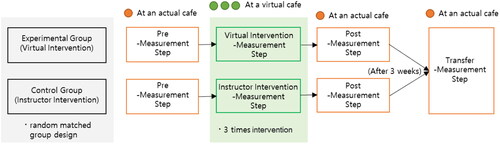
Figure 10. Virtual intervention content for the experimental group.
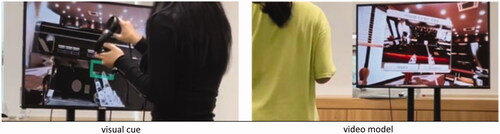
Figure 11. Instructor’s intervention for the control group.
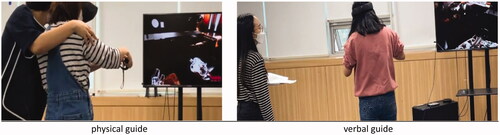
Figure 12. Comparison of job performance rates of virtual intervention and instructor intervention in pre-, post-, and transfer-measurement steps.
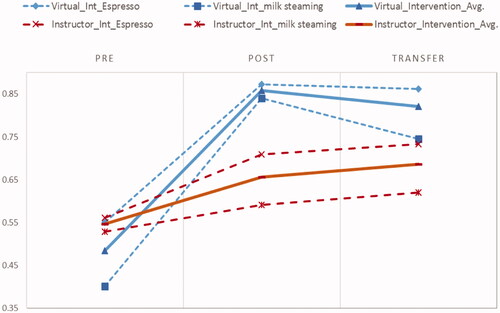
Table 2. Comparison of job performance rates in pre-, post-, and transfer-measurement steps.
Table 3. Statistical results in job performance rates.
Table 4. Ratio of those requesting additional intervention due to a failure of the first intervention (No. of additional interventions/No. of first interventions).
Table 5. Comparison of the average execution time of intervention.
Table 6. Interview results about the effect of virtual barista training.
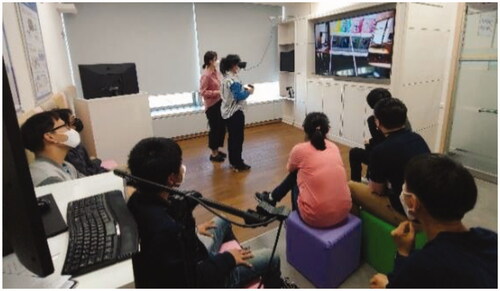
Figure 13. Barista virtual training session at the national vocational training center.