Figures & data
Figure 1. Lalaby app screenshot of the main menu (left), activities (centre), symptoms (right).
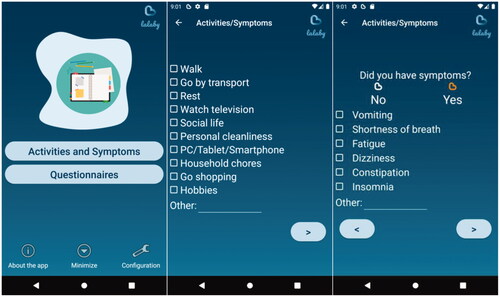
Figure 2. Lalaby app screenshot of the questionnaire menu (left), first question of the EORTC-C30 questionnaire (centre), first question of the ECOG-PS questionnaire (right).
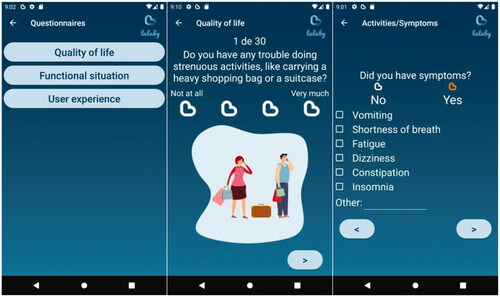
Figure 3. (Top) graph from the Lalaby dashboard of the daily sensor records for Patient 1, (bottom) reported activities, symptoms, and events (chemotherapy cycles).
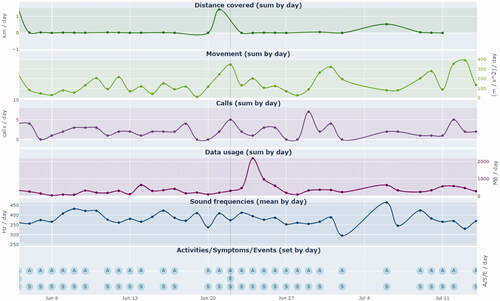
Table 1. Summary table of mean values of the data obtained by the patients’ sensors per day.
Table 2. Summary table of activities, symptoms report EORTC QLQ-C30, ECOG and UEQ-S by Patient 1 and 2
Figure 4. Patient 1: grap of the UEQ-S scales from the Lalaby dashboard. E (Event) indicates dates with “oncologic treatment.” [−0.8, 0.8] Neutral evaluation; [0.8, 3.0] Positive evaluation; [−3.0, −0.8] Negative evaluation.
![Figure 4. Patient 1: grap of the UEQ-S scales from the Lalaby dashboard. E (Event) indicates dates with “oncologic treatment.” [−0.8, 0.8] Neutral evaluation; [0.8, 3.0] Positive evaluation; [−3.0, −0.8] Negative evaluation.](/cms/asset/f0414c5c-e85c-4ace-88f9-d6820f8d9d20/hihc_a_2121561_f0004_c.jpg)
Figure 5. Patient 2: graph of the UEQ-s scales from the Lalaby dashboard. E (Event) indicates dates with “oncologic treatment.” [−0.8, 0.8] Neutral evaluation; [0.8, 3.0] Positive evaluation; [−3.0, −0.8] Negative evaluation.
![Figure 5. Patient 2: graph of the UEQ-s scales from the Lalaby dashboard. E (Event) indicates dates with “oncologic treatment.” [−0.8, 0.8] Neutral evaluation; [0.8, 3.0] Positive evaluation; [−3.0, −0.8] Negative evaluation.](/cms/asset/d26b14ee-fc0a-4566-97f6-ede8603adb48/hihc_a_2121561_f0005_c.jpg)
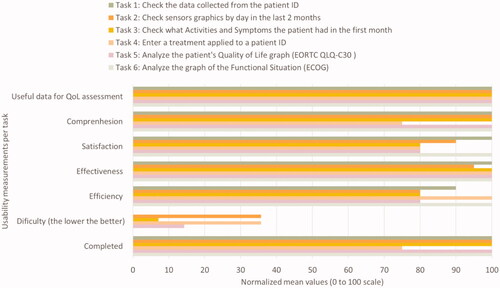
Figure 6. Normalized mean values (0–100 scale) of the usability measures obtained in the onchologists Task test.