
Figures & data
Table 1. Sociodemographic characteristics of the participants.
Table 2. Factor loadings of the Turkish Version of the GAAIS.
Table 3. Descriptive statistics and correlations between variables.
Table 4. Hierarchical multiple linear regression analysis results on the predictive role of various variables on positive attitudes toward artificial intelligence.
Figure 1. Predictors of the Positive General Attitudes toward Artificial Intelligence subscale, with predictors that were significant in the final model showing standardized coefficients (β) and p-values. AIKL: Artificial Intelligence Knowledge Level.
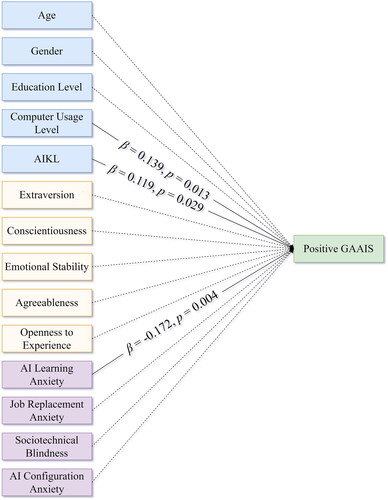
Figure 2. Predictors of the Negative General Attitudes toward Artificial Intelligence subscale, with predictors that were significant in the final model showing standardized coefficients (β) and p-values. AIKL: Artificial Intelligence Knowledge Level.
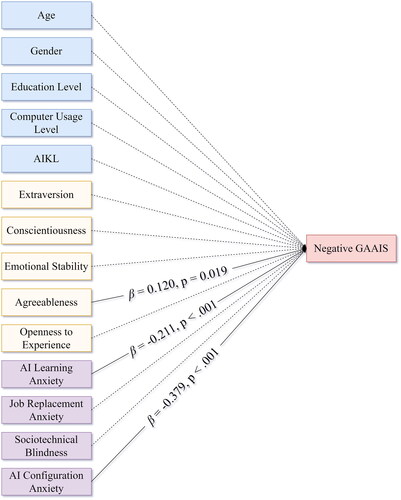
Table 5. Hierarchical multiple linear regression analysis results on the predictive role of various variables on negative attitudes toward artificial intelligence.