Figures & data
Table 1. The 12 upper-body gestures
Table 2. 2D gesture features redefined from 2D features (Kang et al., Citation2021)
Table 3. Details of the datasets collected in the study
Figure 1. Examples of the crowdsourcing collection web page. (a) illustrates the process of collecting gesture videos through online. (b) shows the part of the guidelines page for collecting quality gesture videos. (c) shows a list of gestures with illustrations for participants to select gestures.
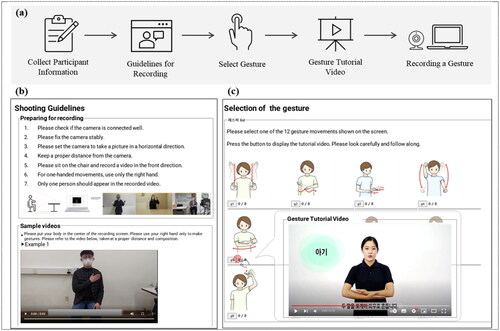
Figure 2. Examples of collected data in the LAB (left) and CR (right) datasets
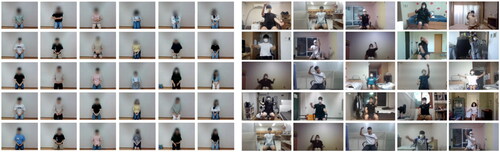
Figure 3. Test accuracy of the four models according to the number of participants. The test results were evaluated with TE-CR data.
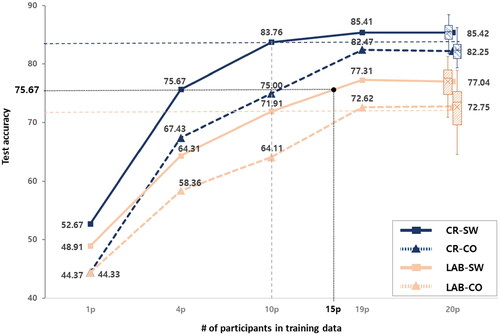
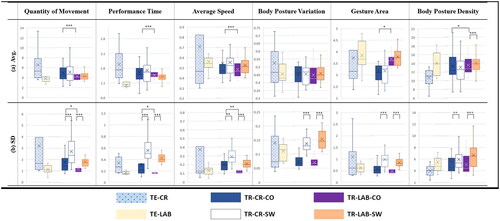
Figure 4. Boxplots of (a) average and (b) standard deviation for the six gesture features (QoM, PT, AS, BPV, GA, and BPD). Boxplots from left to right for each graph: TE-CR, TE-LAB, TR-CR-CO, TR-CR-SW, TR-LAB-CO, TR-LAB-SW (*p < 0.05, **p < 0.01, ***p < 0.001)