
Figures & data
Table 1. List of metrics in eye tracking, their meaning and relationship with analysis of learning strategies.
Table 2. Descriptive statistics of the participants with respect to the variables age and gender.
Figure 1. Stimuli used in eye tracking in the study.
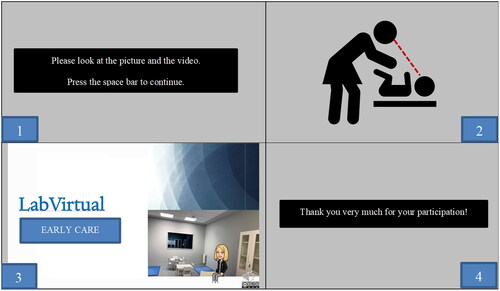
Table 3. Stimuli applied in the study and their relationship with cognitive load.
Table 4. Skewness and kurtosis analysis of the independent variable.
Figure 2. Steps in the study procedure.
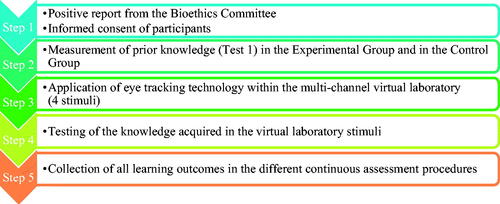
Figure 3. Relationship between RQs and research design.
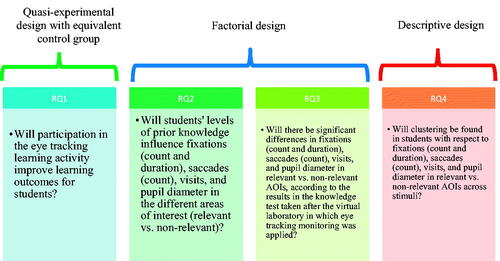
Table 5. One-factor fixed-effects ANOVA (participation in the early intervention case study virtual laboratory vs. non-participation).
Table 6. One-factor fixed-effects ANOVA (level of prior knowledge).
Table 7. One-factor fixed effects ANOVA (degree of knowledge acquired) on eye tracking parameters (FC, FD, SC, No. and PD) for stimulus 3 in AOI_NR and R.
Figure 4. Elbow method in the k-means algorithm on FC, FD, SC, visits and pupil diameter data. Note. 1. Elbow method in FC, 2. Elbow method in FD, 3. Elbow method in SC, 4. Elbow method in Visits, 5. Elbow method in pupil diameter.
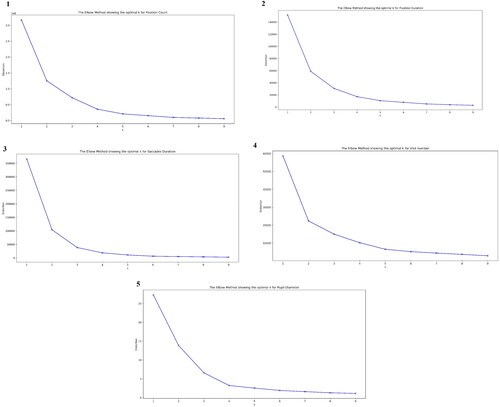
Table 8. Final cluster centres and ANOVA for FC.
Table 9. Final cluster centres and ANOVA for FD.
Table 10. Final cluster centres and ANOVA for SC.
Table 11. Final cluster centres and ANOVA for No. of Visits.
Table 12. Final cluster centres and ANOVA on pupil diameter.
Figure 5. Visualisation of the clusters in the parameters FC, FD, SC, visits and pupil diameter in each participant. Note: FC: Fixation count; FD: Fixation duration; SC: Saccade count; V: Number of visits; PD: Pupil diameter.
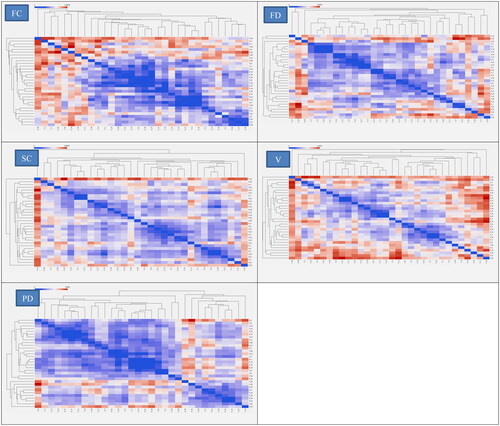
Table C1. Relationship between the RQs proposed in this study, the experimental studies basis for this study and the findings of this study.