
Figures & data
Figure 1. Research model.
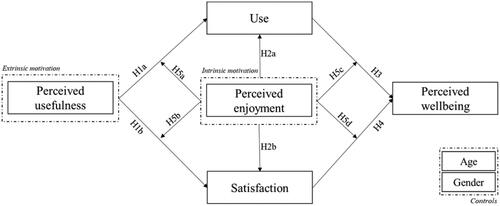
Table 1. Sample characteristics.
Table 2. Mean, standard deviation, CR, and Fornell-Lacker table.
Table 3. Heterotrait-Monotrait Ratio.
Figure 2. Structural model results (Note: ***p < 0.01; **p < 0.05, *p < 0.1).
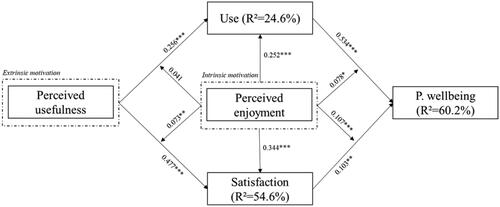
Figure 3. Moderation of perceived enjoyment (PE) between perceived usefulness (PU) and satisfaction.
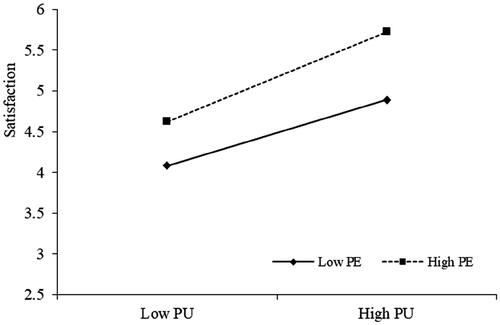
Figure 4. Moderation of perceived enjoyment (PE) between use and perceived well-being.
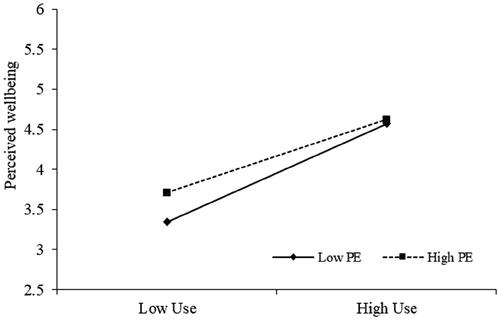
Figure 5. Moderation of perceived enjoyment (PE) between satisfaction and perceived well-being.
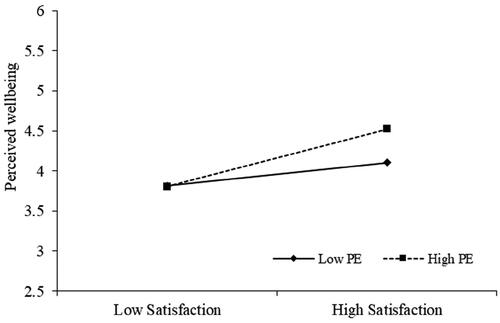
Table A1. Interviewees’ details.
Table B1. Survey items.
Table C1. Age and gender distribution.
Table D1. Loadings and cross-loadings.