
Figures & data
Table 1. Sample details of Study 1A, 1B, and 1C.
Figure 1. Violin and box plots of participants’ ratings by condition for Studies 1A, 1B, 1C and 2. Note that the diamond within the boxplots represents the mean.

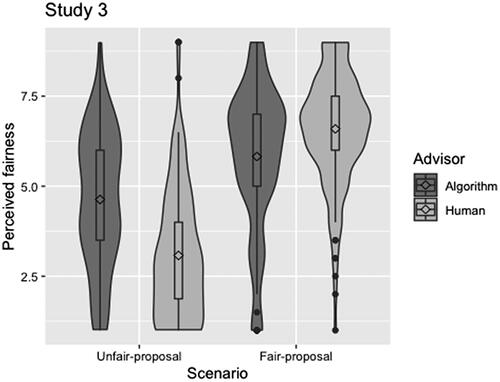
Figure 2. Violin and box plots of participants’ ratings on perceived fairness as a function of scenario and advisor conditions for Study 3. Note that the diamond within the boxplots represents the mean.
Supplemental material