
Figures & data
Figure 1. The feedback system of Coral Morph.
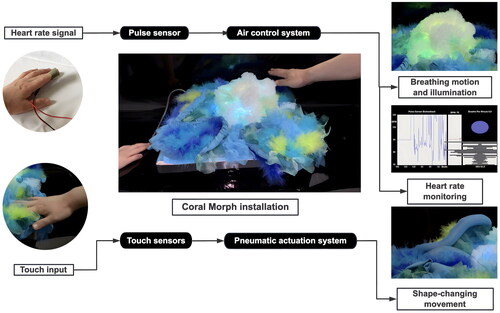
Figure 2. The design and evaluation framework of Coral Morph.
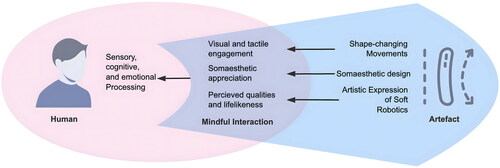
Figure 3. Two different states of Coral Morph during shape-changing movement.
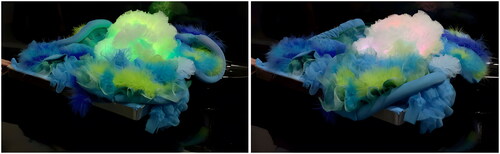
Table 1. Participants ’demographic information.
Figure 4. The exhibition. (a) The pulse sensor connected to the participant’s finger; (b) one participant interacting with Coral Morph.
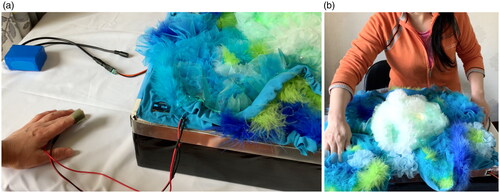
Figure 5. The frequency of emotions occurred (a) before and (b) during the interaction.
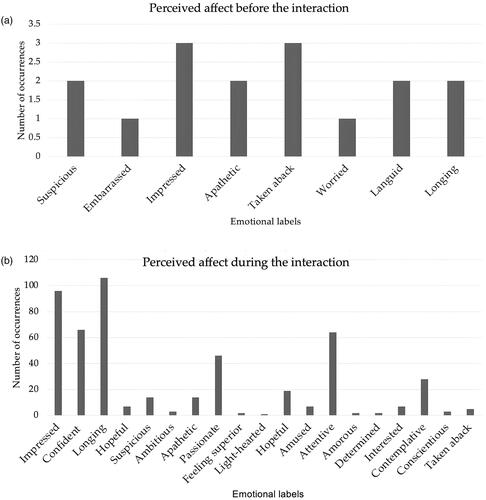
Figure 6. The Emotional Wheel with top identified emotions highlighted.
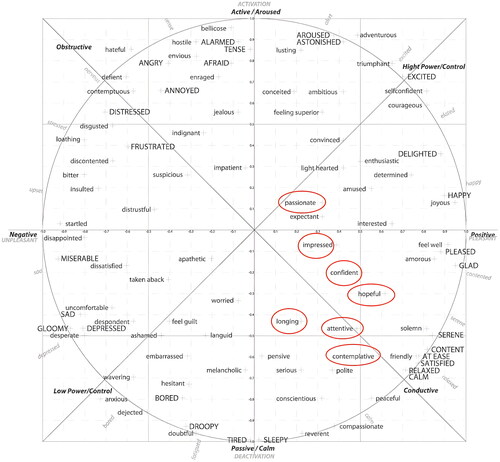
Figure 7. The data distribution graph of facial emotions..
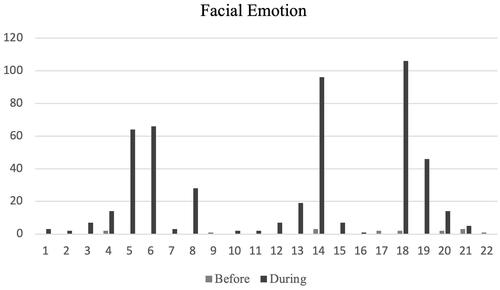
Table 2. Descriptive statistics for the facial emotions.
Table 3. Test of normality for the facial emotions.
Table 4. Descriptive statistics for the SAM arousal and valence.
Figure 8. A radar plot of the average BMIS.
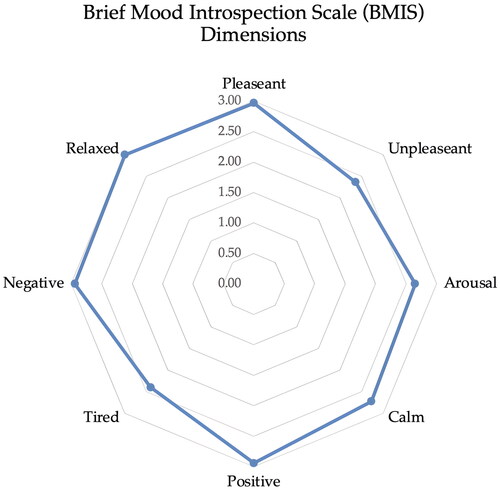
Table 5. Descriptive statistics for the BMIS dimensions.
Table 6. Between-subjects effects.
Table 7. Self-reported emotions according to gender.
Table 8. Mindfulness, arousal, and valence difference.
Table 9. MANOVA with Roy’s largest root.
Table 10. Between-subjects effects.
Table 11. Trait-meta mood scale (TMMS) dimensions descriptive statistics.
Table 12. Descriptive statistics for the STQ.
Table 13. Descriptive statistics for the GQS dimensions.
Table 14. Descriptive statistics for the PSI dimensions.
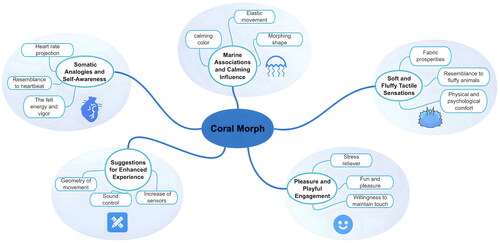
Figure 9. Five themes generated from the verbal reports during the experience.
Appendices new.docx
Download MS Word (51.5 KB)Data availability statement
The pseudo anonymized data supporting the findings of this study can be requested from the corresponding author.