
Figures & data
Figure 1. Examples of the VR app and educational scenes [A] app, phone and Google CardboardTM, [B] red reflex, [C] haemorrhage and [D] quiz.
![Figure 1. Examples of the VR app and educational scenes [A] app, phone and Google CardboardTM, [B] red reflex, [C] haemorrhage and [D] quiz.](/cms/asset/651ba756-4e81-4bbc-9271-1e147eb5a25f/hihc_a_2318535_f0001_c.jpg)
Table 1. SUS statements.
Table 2. TA statements.
Table 3. Model summary table.
Table 4. Regression model.
Table 5. Coefficients.
Table 6. Breakdown of test scores.
Figure 2. Flow diagram of development process for medical simulations.
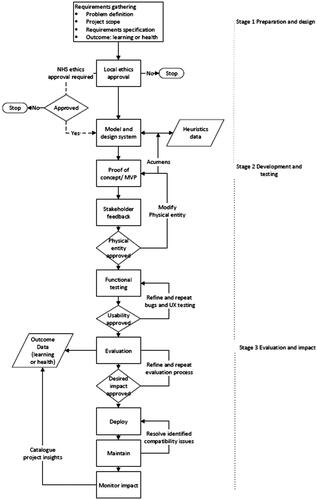
Table 7. Comparison and conformance for software development frameworks (Hesari et al., Citation2010).
Data availability statement
All data generated or analysed during this study are included in this published article.