
Figures & data
Figure 1. Stimulus examples for each combination of segment type and image type.
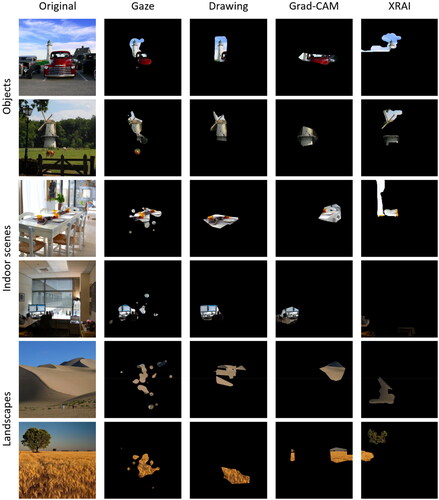
Figure 2. Generating image segments that uncover the most important 5% of the image area, depending on segment type.
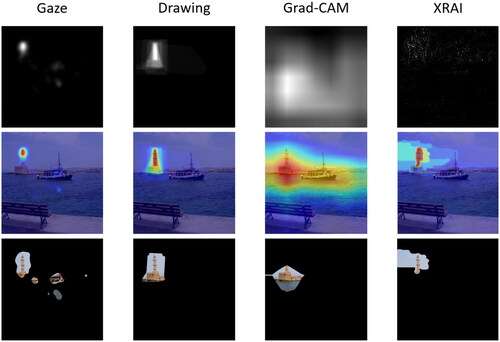
Figure 3. Overview Of the procedure of experiments 1 and 2. CR = correctness rating.
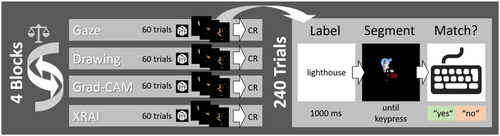
Figure 4. Response times (A) and error rates (B) for Experiment 1, depending on segment type and image type. Error bars represent standard errors of the mean.
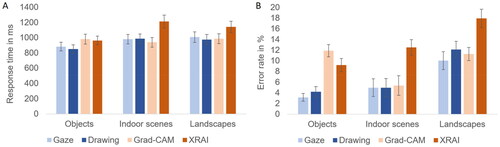
Table 1. Possible combinations of labels and segments for incompatible trials in Experiment 2.
Figure 5. Response times (A) and error rates (B) for Experiment 2, depending on segment type and image type. Error bars represent standard errors of the mean.
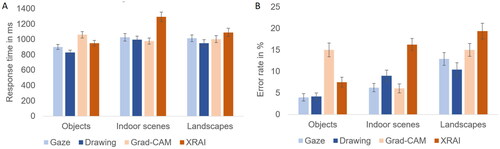
Figure 6. Ratings from Experiment 3, depending on segment type and image type. Results are presented (A) in their original coding (i.e., higher values reflect better ratings) and (B) in inverse coding (i.e., higher values reflect discrepancy from optimum) to facilitate visual comparison with the results of experiments 1 and 2 presented in and . Error bars represent standard errors of the mean.
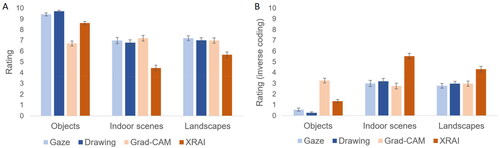
Figure 7. Comparison of objective and subjective measures in their ability to reflect differences between image types and segment types. Each line represents an individual image. Darker shades of red indicate worse performance, and the coding of subjective ratings was inverted accordingly. Each cell contains the average values of 24 participants for errors and response times, and of 32 participants for ratings.
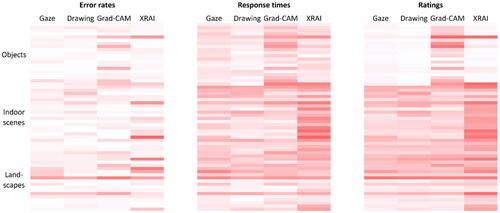
Table 2. Number of images included in each segment size for the human segment types. Numbers for the XAI segment types are not included as they were always 20 (i.e., all images were included).
Table 3. Mean values and standard deviations (in parentheses) for DNN performance in terms of true class certainty and top-5 accuracy, depending on segment type and image type.
Figure 8. DNN performance change with increasing segment size in terms of true class certainty and top-5 accuracy, depending on image type and segment type. For the human segments, larger segment sizes only include the data of images in which attention was spread beyond the respective area size. Thus, incomplete lines indicate that no participant attended a larger area for any of the 20 images. The dot at a segment size of 100% indicates DNN performance on the original, unmasked image.
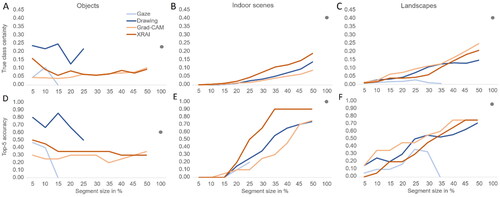
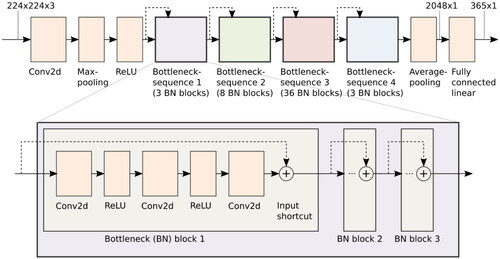
Figure A1. Schematic visualization of our ResNet-152 implementation. Most layers are contained in bottleneck blocks inside one of four bottleneck sequences and thus not shown. Each bottleneck sequence reduces the resolution and increases the number of feature maps. The dashed arrows depict the residual connections (i.e., addition of intermediate results from previous layers, which are the distinctive feature of the ResNet architecture).
Data availability statement
All images and human participant data are made available via the Open Science Framework (https://osf.io/pvmfj/). The source code for our DNN, XAI, and attention maps is made available on GitHub (https://github.com/cknoll/Humans-vs.-CNN-Effects-of-task-and-image-type).