
Figures & data
Figure 1. A screenshot of the spider vacuuming application.
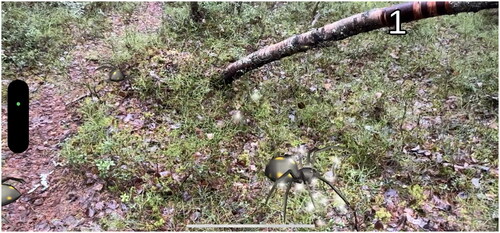
Figure 2. A screenshot of the spray painting application.
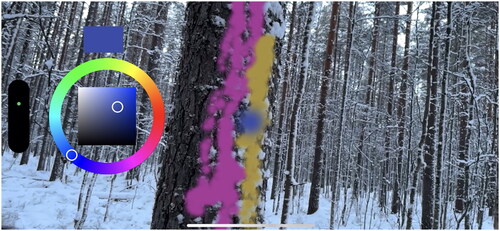
Figure 3. A screenshot of the point cloud visualization application.
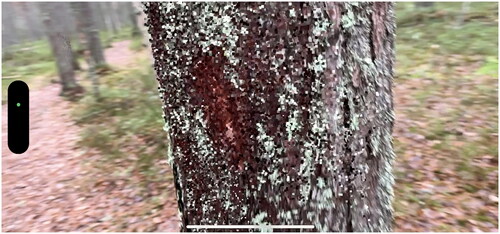
Table 2. Interview guide.
Table 1. Data sources collected for this study.
Table 3. Demographic characteristics of the participants and the environment for their experiment.
Figure 4. Ground points and non-ground points of P12.
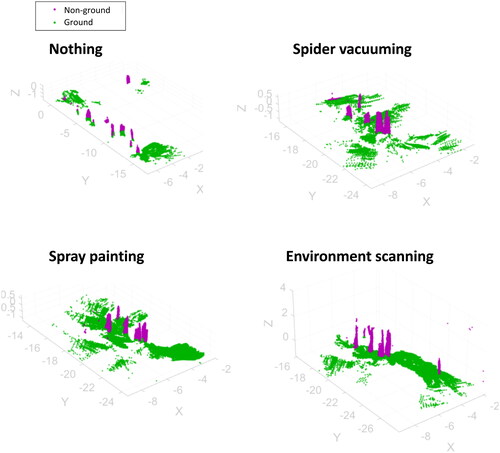
Figure 5. Most and least favorite AR scenario.
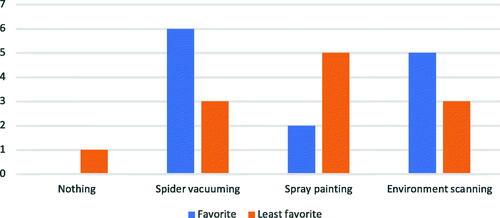
Table 4. Summarizing a crude estimate of the effects of the four gamification designs on three key categories in terms of point cloud generation: movement, focus on detail, and vertical change.
Figure 6. A Boxplot showing the variation in the point cloud-derived metrics by the applied gamified scenario. On each box, the red vertical line indicates the median and the bottom and top edges of the box indicate the 25th and 75th percentiles, respectively. The whiskers extend to the most extreme data points not considered outliers, and the outliers are plotted individually using the “+” marker symbol.
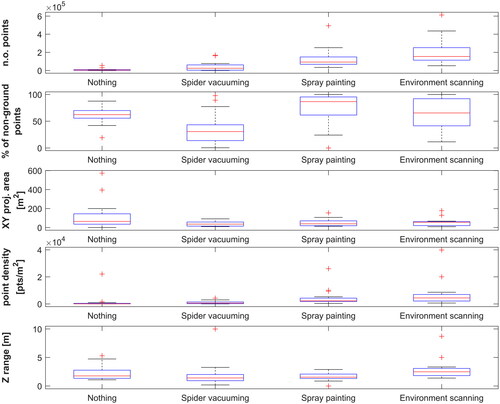
Table 5. The p-values of paired-sample t-tests quantifying statistical differences in the point cloud metrics between gamified scenarios. Bolded values imply statistical significance in the observed difference at 95% confidence (i.e., p < 0.05).
Table 6. Suitable interactions for specific goals.