
Figures & data
Table 1. Factors potentially related to trust in artificial intelligence (AI).
Table 2. Key demographic characteristics of participants.
Table 3. Descriptive statistics and reliability and validity indices of 22 key measures.
Figure 1. Trust in AI by participant group. (A) by three age groups, (B) by two levels of subjective social status, (C) by two levels of education, (D) by sex, and (E) by four economic regions in China. Error bars indicate one standard deviation.
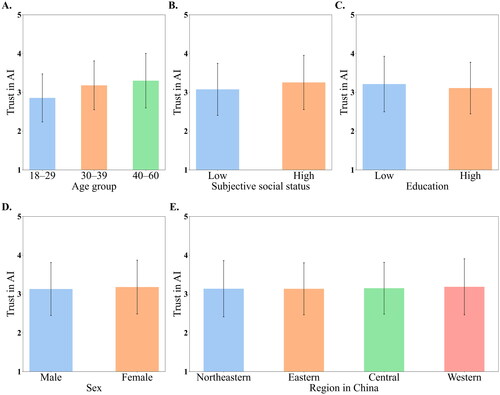
Table 4. Correlation coefficients among the 22 key variables.
Figure 2. Cumulative adjusted R2 in a stepwise regression analysis of trust in artificial intelligence. Each bar represents the cumulative R2 contribution of a factor that was entered into the regression model. Nine factors were selected, and they are ordered by their selection sequence. The bars are color-coded to indicate the trust dimension to which each selected factor belongs.
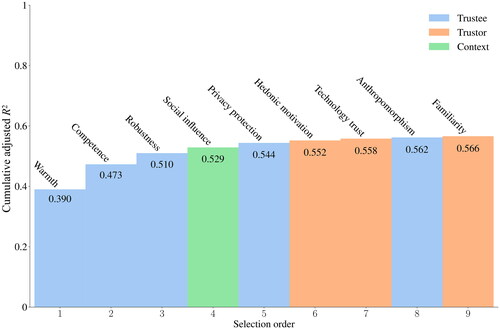
Figure 3. Interactions among warmth, competence, and three other factors related to trust in artificial intelligence (AI). (A) The interaction between warmth and competence. High and low levels of warmth and competence correspond to one standard deviation above and below the mean, respectively. Values of trust in AI were the mean residual values after controlling for demographic and individual variables. (B), (C), and (D) The standardized direct and indirect effects of three factors on trust in AI with warmth and competence as the mediators. Δb is the mediation effect of warmth minus that of competence. Path coefficients in each model were significant with ps < 0.001. CI: confidence interval.
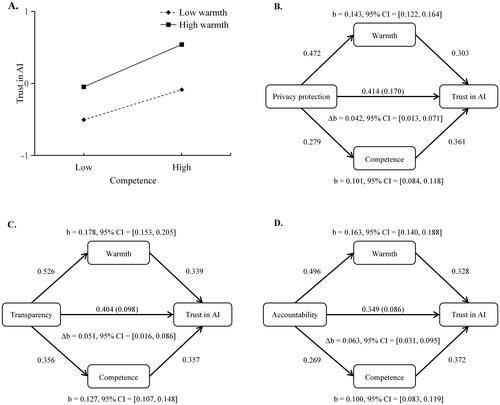
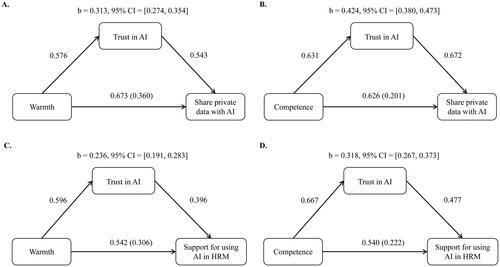
Figure 4. The direct and indirect effects of warmth and competence on two behavioral intention measures with trust in artificial intelligence (AI) as the mediator. (A) and (B) Intention to share private data with AI as the intention measure. (C) and (D) Support for using AI in HRM as the intention measure. The path coefficients in each model were significant with ps < 0.001. The results for support for using AI in HRM were based on data from participants who reported being currently employed (N = 1701). CI: confidence interval; HRM: human resources management.
Trust in AI_Supplemental Material.pdf
Download PDF (1.2 MB)Data availability statement
Data pertaining to the analyses and results of this study can be accessed without restrictions at https://osf.io/z4qr2.