
Figures & data
Figure 1. AQMS mobile user.
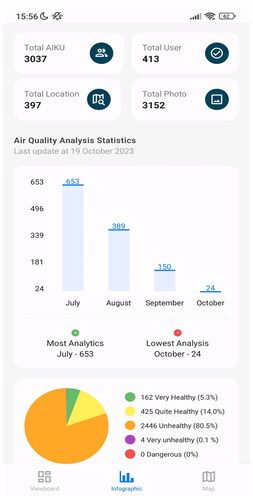
Table 1. Dataset AQMS test.
Table 2. Study of the art TR.
Figure 2. Conceptual framework.
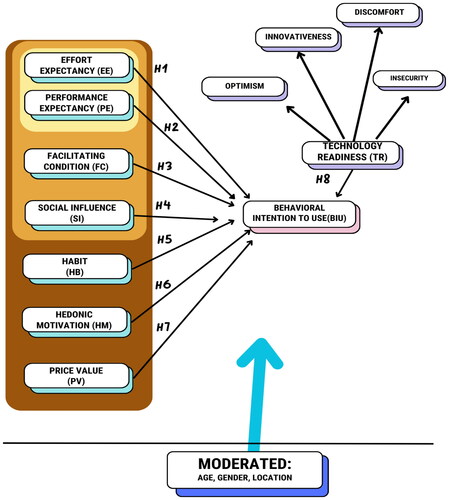
Figure 3. The demographic data of the respondents (n = 371).
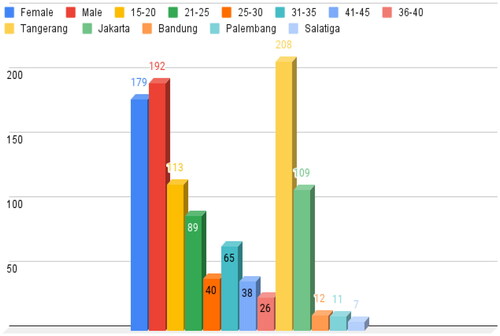
Table 3. Data reliability.
Table 4. Fornell-Larcker.
Table 5. Results of R2 value.
Table 6. GOF Index.
Figure 4. Hypothesis result. Note: ** p < 0.01, *** p < 0.001 (Ko & Lee, Citation2017).
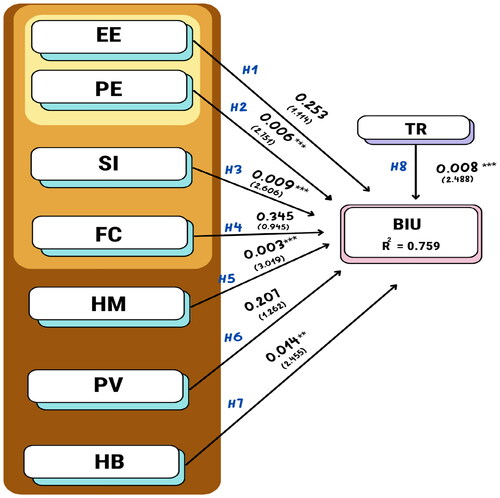
Table 7. Path coefficients and results of hypothesis testing.
Table 8. Technology readiness result.
Table 9. Comparison of groups of paths towards gender.
Table 10. Comparison of groups of paths towards age.
Table 11. Comparison Of groups of paths towards location.