Figures & data
Figure 1. An example of a lambda function definition in Lattice. The declaration formula lives in cell C2, while the colored cells C3:C7 represent the constituent parts of a lambda, i.e., the arguments, followed by the body and the return value cell within the body range.
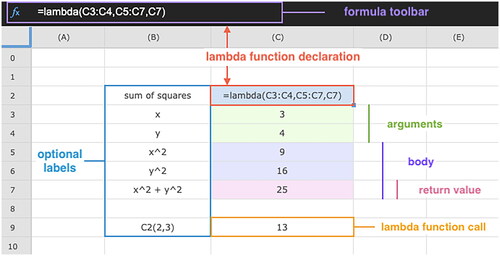
Figure 2. An example of a user-defined function SUMOFSQUARES, that calculates the sum of the squares of two numbers, implemented in Apps Script (B) and used in Google Sheets (A).
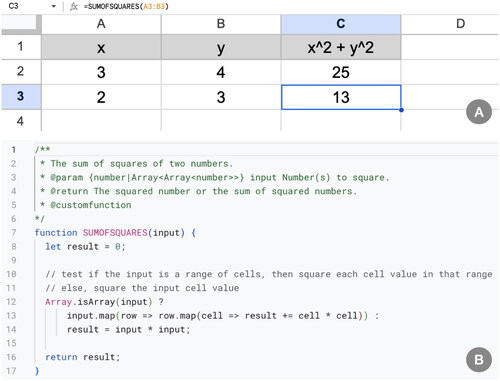
Figure 3. Highest education levels of the participants in each category (learner/experienced).
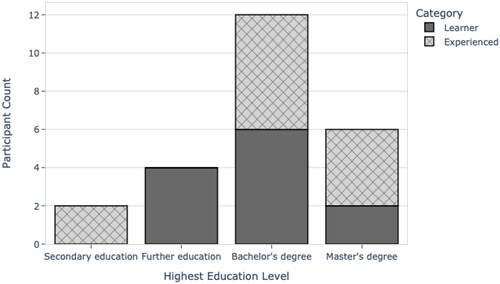
Figure 4. Distribution of the self-assessed levels of programming knowledge (from introductory to expert) and spreadsheet expertise (from beginner to expert) per participant category (learner/experienced).
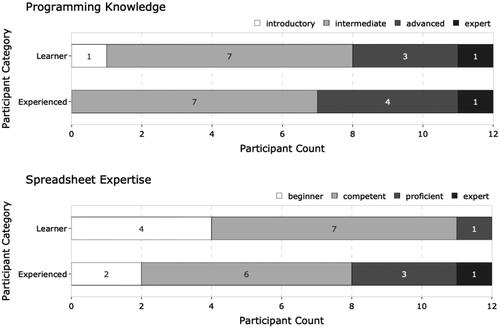
Figure 5. Information on the demographics and skills of the participants. P01-P12 are learners; P13-P24 are experienced programmers. Education refers to the highest education level achieved. Programming knowledge and spreadsheet expertise were self-assessed by the participants.
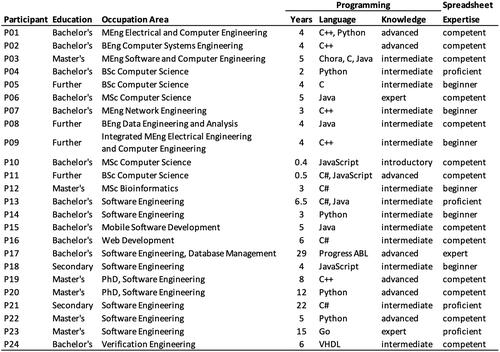
Table 1. Distribution of the years of programming experience of the participants per category (learner/experienced).
Figure 6. Schematic and the corresponding truth table of each of the two Boolean equations (A – left and B – right) that participants needed to implement during task completion.
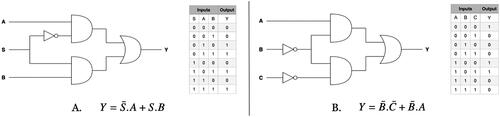
Table 2. Measures of performance per task for our study conditions (WL and NL), including success rate, average completion time (t in minutes) and its standard deviation (SD).
Figure 7. Mean completion time (in minutes) per task for each study condition. Error bars represent standard deviation. n = 20 (WL), 22 (NL) sample points.
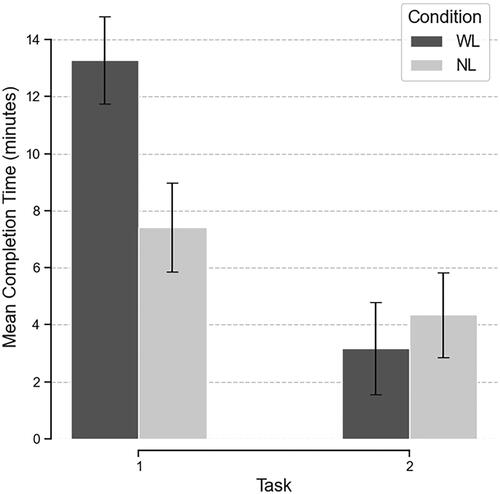
Table 3. The Spearman’s correlation test to evaluate the association between the years of programming experience of participants and their task completion time for the two study conditions per task.
Table 4. The types of errors made by participants during task completion and their number.
Table 5. Measures of central tendency (mean; median) and dispersion (standard deviation – SD; the interquartile range – IQR) of the six UEQ scales for WL and NL conditions.
Figure 8. Comparison of the UEQ scale medians between WL and NL conditions. Centre lines indicate the medians; boxes indicate the 25th (Q1) and 75th (Q3) percentiles; whiskers extend 1.5 times the interquartile range from Q1 and Q3. n = 24 sample points per condition.
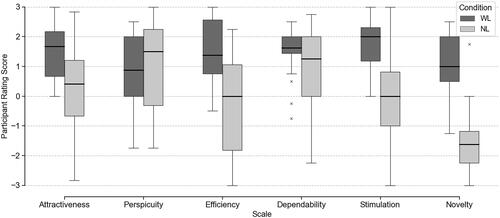
Table 6. The Wilcoxon signed-rank test to compare WL and NL conditions based on the six UEQ scales.
Table 7. Comparison of the scale means in our study to the UEQ benchmark dataset.
Table 8. Participant distribution for every statement in our custom-designed post-activity questionnaire.
Figure 9. A concept map of the themes (ellipses) and sub-themes (rectangles) developed through thematic analysis of the participant comments.
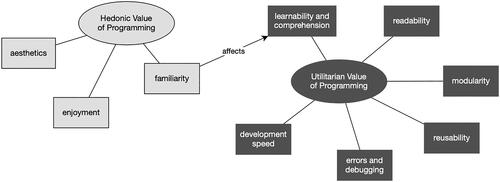
Figure A1. A 26-item UEQ in English.
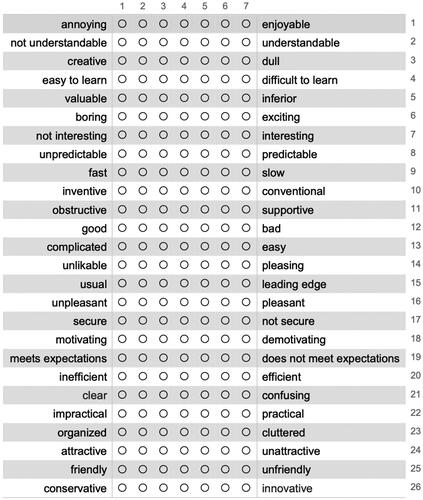
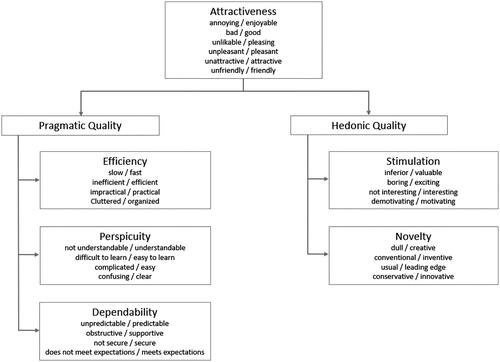
Figure A2. The assumed scale structure of the User Experience Questionnaire (Schrepp, Citation2015).