Figures & data
Figure 1. The three SERP viewing formats examined: (a) list view, (b) GKG view, (c) clustered list view.
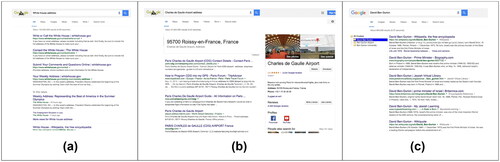
Figure 2. Examples of common GKG views: (a) summarization - specific GKG info box for the query, "bill gates net worth," (b) language ambiguity for “columbia,” (c) discovery GKG for “the beatles,” (d) specific GKG info box for “brad pitt age,” (e) comparison tool results for “white wine vs. red wine,” (f) GKG weather box for “weather in New York,” (g) GKG location-based list for “laundry in amsterdam,” (h) GKG carousel for “female politicians in US.”.
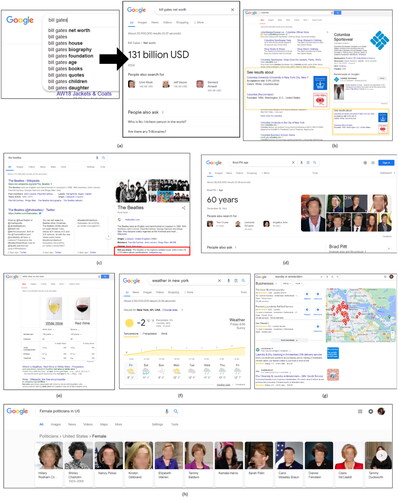
Figure 3. Google extension icon which enabled switching between the views.
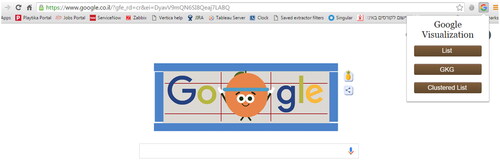
Table 1. An example of the assignment of the questions and queries for each task type when using the different views.
Figure 4. Average effectiveness for each task using each view.
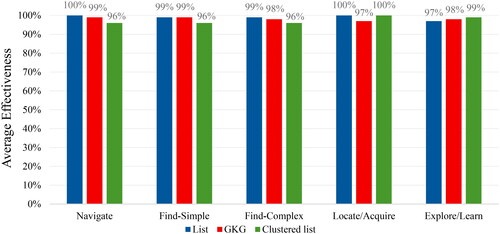
Figure 5. Average performance times for each task when using each view (vertical bars denote 0.95 confidence intervals).
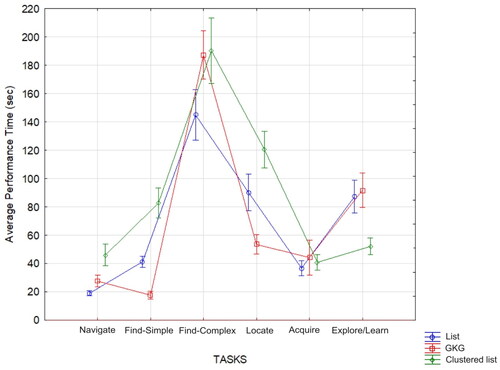
Table 2. Average (SD) performance times (sec) for each task when using each view. The % represents the difference between the view in a specific row and the most efficient view (background highlighted) for each task type.
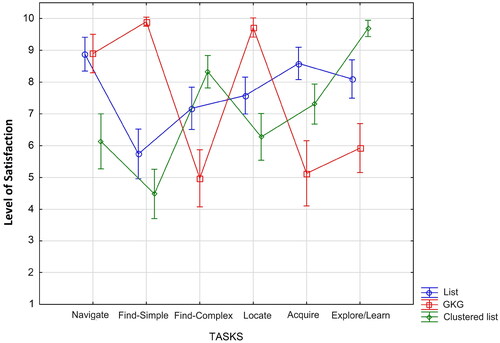
Figure 6. The level of satisfaction as a function of the task type and viewing format (vertical bars denote 0.95 confidence intervals).