Figures & data
Figure 1. Conceptual model.
Table 1. Descriptive statistics of consumers’ ambiguity tolerance (AT), confusion avoidance (CA) and purchase intention (PI).
Table 2. Kaiser–Meyer–Olkin (KMO) and Bartlett’s test of sphericity.
Table 3. Measurement model.
Table 4. Descriptive statistics and correlations among the latent constructs.
Table 5. Goodness of fit indices.
Table 6. Demographic profile of the respondents.
Table 7. Respondents’ frequency and levels of their given scores for different constructs.
Table 8. Results of structural equation modeling: standardized path estimates.
Table 9. Results of the two regression models: the effects of demographics on confusion avoidance and ambiguity tolerance.
Figure A1. Consumers Confusion
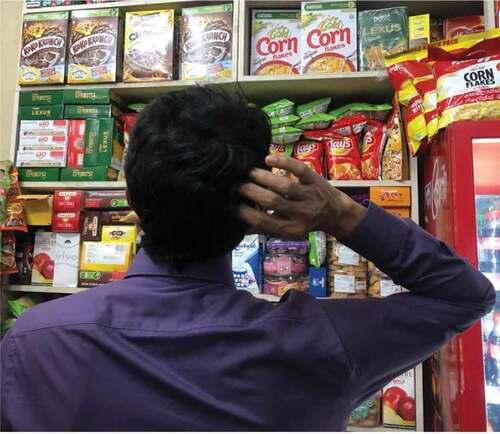
Figure A2. Consumer ambiguity.